Download
1 / 36
370 likes | 502 Views
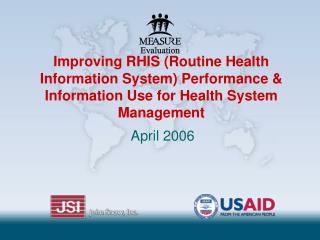
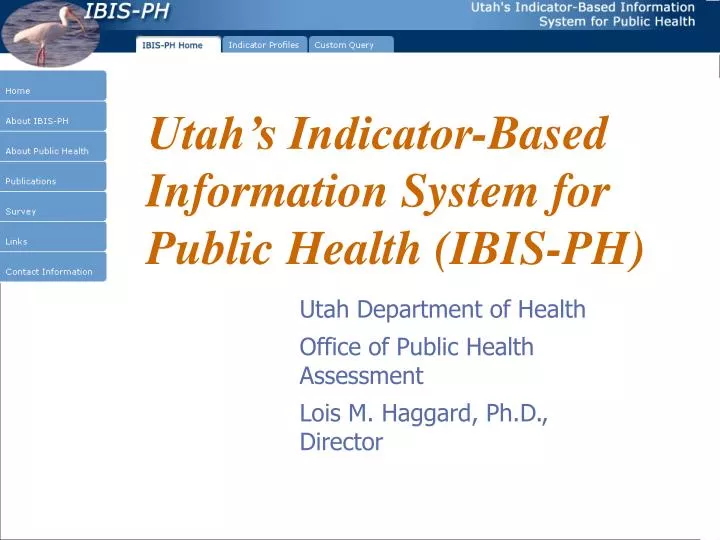
Utah’s Indicator-Based Information System for Public Health (IBIS-PH). Utah Department of Health Office of Public Health Assessment Lois M. Haggard, Ph.D., Director. UDOH Organizational Structure.

E N D
Utah’s Indicator-Based Information System for Public Health (IBIS-PH) Utah Department of Health Office of Public Health Assessment Lois M. Haggard, Ph.D., Director
UDOH Organizational Structure The UDOH executive director takes a personal interest in IBIS. The Center for Health Data is located in the Executive Director’s Office. Executive sponsorship is extremely important to the project’s success.
IBIS Capabilities • Displays general static web site content with a consistent look and feel without having to code the entire web page. • Displays Indicator Reports (aggregated data values with associated contextual data). • Provides Web-based interface for distributed maintenance of Indicator Profile data. • Provides realtime SAS dataset queries. • Allows DOH to define the query interfaces without having to know the Web technologies (HTML, CSS, Javascript).
web <html> <head> <META http-equiv="Content-Type" content="text/html; charset=ISO-8859-1"> <title> IBIS-PH Welcome to IBIS-PH; Utah's Public Health Data Resource</title> . . . …sends request (URL)… Client / Internet User… … to Web server. …sends response (HTML)… …to Client / Internet User. Web server Web Basics http://ibis.health.utah.gov
http://ibis.health.utah.gov Utah’s IBIS-PH homepage provides access to all areas of the website and information on new features. This is a standard home page template, but states adopting IBIS can modify the content and the look of the page.
IBIS Information Dissemination Model: Most frequently-asked questions are answered in paper (.pdf) publications and in our Indicator Profile reports. Users who’d like more detailed analysis or sub-populations can use the interactive query system. If none of those systems answer their question, they must go to the “old” system of calling us on the phone.
Custom Data Query • Allows users to query health data sets directly • General audience • User-friendly GUI interface • Sound epidemiology • Help descriptions & instructions • Bullet-proof – can’t confuse or give misleading answers, can’t allow users to do “stupid” things The IBIS Query system allows members of the general public to access several public health data sets and generate query results based on their specifications.
3. Use “QueryBuilder” page to select query parameters and submit query.
The IBIS query system can also produce map views of data. Maps provide mouse-over information and zooming if the user has Adobe’s SVG viewer installed.
html html html html IBIS-Q Custom Query System IBIS-Admin IBIS-View IBIS-Q
IBIS Indicator Reports • Allows users to view a report of data that have already been tabulated. • For more novice users, easier, more user-friendly. • Webpage CONTENT MANAGEMENT and REPORT GENERATION system, not a query system.
Utah has ~140 indicator profiles currently published. They are indexed in an alphabetical index (pictured here) and also in a categorical index that allows indicators to be placed in any of several categorization schemes, such as by program, by data source, or HP2010 focus area, etc.
Each indicator has a default graph that comes up on the indicator main page.
The main page also allows navigation to a table of numbers for the current graph, as well as access to additional graphs (if they exist). We also include the measure definition and a message on why it is an important construct in public health.
IBIS graphs are displayed using SVG (scalable vector graphics, a standard form of XML). They use commercial software from Elansoft that allows for interactive mouse-overs. Users must have an SVG-Viewer from Adobe (similar to Adobe Acrobat) installed on their computer to use the mouse-over capability. However, if a user does not have the SVG-Viewer installed, the IBIS system will produce a jpeg image and display the image in place of the SVG.
Numerator* Denominator* Important facts about each measure include a number of fields. Not all fields are mandatory – mandatory fields are shown here with an asterisk. Definition* Data Interpretation Issues Why Is This Important?* HP 2010 Objectives* Other Objectives How Are We Doing? Utah Versus U.S. What Is Being Done? Other Program Information
The IBIS indicator profiles allow users to see how the current measure might be related to other measures.
For instance, an important health status outcome for binge drinking is motor vehicle crash injuries.
Programs can use IBIS to inform the general public of services and resources.
html html IBIS Indicator Reports System IBIS-Admin IBIS-View IBIS-Q
Program staff from across the department use a website, called the “IBIS Admin site” to access the database and modify data records. Once an indicator has been set up, the maintenance is minimal, generally limited to annual update of numeric data and modification of text to reflect those changes. IBIS Admin Site • GUI Interface for DB Access • Used by busy folks who do not necessarily have website publishing or DB data entry skills (with no interest in acquiring them) • Must be user-friendly, follow good IS rules/heuristics
This is a (gross) oversimplification of the IBIS database structure. Certain information is stored at the indicator level, such as definition and HP2010 objectives. Each indicator may have one or more graphical data views. Each graph view has multiple data points (indicator view values). Indicator View Values Admin DB, Relational DB Entities (Tables)
This is the indicator main page, where we have provided text boxes to maintain some of the fields at the indicator level.
Indicator developers can add as many graph views as desired.
Numeric graph values may be hand-entered or plugged-in by the query system.
Components of the IBIS Software html IBIS-Admin IBIS-View IBIS-Q
Files Maintained by PH Staff IBIS-Admin IBIS-View IBIS-Q
Thank you! • Lois M. Haggard, Ph.D. • Office of Public Health Assessment • Utah Department of Health • loishaggard@utah.gov • (801) 538-9455