Download
1 / 62
650 likes | 895 Views
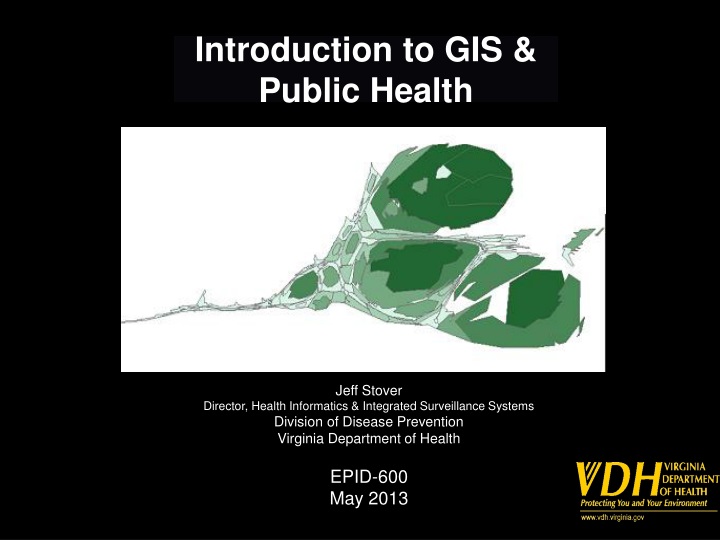
Introduction to GIS & Public Health. Jeff Stover Director, Health Informatics & Integrated Surveillance Systems Division of Disease Prevention Virginia Department of Health EPID-600 May 2013. Overview. GIS defined The geographic foundation for PH Public Health GIS history and use

E N D
Introduction to GIS & Public Health Jeff Stover Director, Health Informatics & Integrated Surveillance Systems Division of Disease Prevention Virginia Department of Health EPID-600 May 2013
Overview • GIS defined • The geographic foundation for PH • Public Health GIS history and use • visualization • Geocoding & Data Management • GIS & Privacy
What is GIS? A geographic information system is an integrated collection of computer software and data used to view and manage information about geographic places, analyze spatial relationships, and model spatial processes.1 A computer-assisted system for the capture, storage, retrieval, analysis and display of spatial data.2 Computer-based systems for integrating and analyzing geographic data.3 1 A to Z GIS. ESRI Press. 2 Clarke, 1986. p. 175 3 Cromley and McLafferty. 2002
The Geographic Foundation for Public Health • Answers the basic question… “where?” • Where do people live? • Where are the agents of disease or specific health-related events? • Where can we intervene to eliminate/reduce risks or to improve health service delivery? • People and the factors that cause disease are dispersed, often unevenly, across communities and regions.
http://www.cdc.gov/hiv/library/reports/surveillance/2011/surveillance_Report_vol_23.htmlhttp://www.cdc.gov/hiv/library/reports/surveillance/2011/surveillance_Report_vol_23.html
Beginnings 1970’s Internal reports Late 1990’s ODW OASIS HIV/STD Office of Epidemiology Fish advisories Environmental Epi Enterprise GIS EP&R H1N1 GIS at VDH
District: Fairfax Reported: 50 A rollover on the district shows the name and the reported number of cases Note: A lower than normal reporting week would also appear on the map
Does GIS provide “added value”? GIS is a tool for understanding how spatial relationships can and/or do affect an outcome [e.g., public health]. Is GIS more than just maps (“eye candy”)?
9,979 cases extracted Missing address (N=587, 6%) 9,359 cases with addresses Error in match codes (N=639, 7%) 8,652 cases inside boundary Outside city boundary (N=104, 1%) 8,756 cases with valid addresses Age < 10 years old (N=9, 0.1%) A total of 8,643 cases (86.6% of extracted) included Qian Zhang, Oana Vasiliu, Chris Delcher, Jeff Stover Health Informatics and Integrated Surveillance Systems, Division of Disease Prevention, Virginia Department of Health, Richmond, Virginia Summary Introduction: In Virginia, Richmond city has been historically recognized as a locality with one of the highest gonorrhea rates in the country. The aim of this presented population-based study on gonorrhea is to identify statistically significant geographic clusters. Methods: We analyzed reported gonorrhea diagnoses (n=8,643) between 2000 and 2007 in the city of Richmond, Virginia. Gonorrhea cases were geocoded and mapped to block groups (n=163). Gonorrhea incidence rates for each block group were calculated. A spatial scan statistics is conducted to identify core areas with elevated rates. Results: The average yearly incidence rate of gonorrhea in Richmond was 681 per 100,000. Of the total number of cases, 85.9% were under the age of 35, and 84.9% were Black. Seven clusters with higher-than-expected rates (p=0.0001) were identified. The most likely cluster was located on the northeastern part of the City, with an annual incidence rate of 1449.4 per 100,000. Cases occurred in this cluster represented 21 percent (1084 cases) of the total number of gonorrhea cases in Richmond over 8 years. Conclusion: there is sufficient evidence about the existence of statistically significant gonorrhea clusters in Richmond, Virginia. The spatial scan analyses at the block group level provide geographic details that can improve STI surveillance and interventions. Results Geocoding Figure 1: GeoStan TM Data Flow Chart Spatial Analysis of Gonorrhea Incidencein Richmond, Virginia, 2000-2007 Introduction TABLE 2. Gonorrhea clusters identified by spatial scan statisctics using SaTScan ver. 7.0.3.,Richmond, Virginia, 2000-2007. Core areas were defined as those with 10 % of its population at risk. • Gonorrhea is the second most common sexually transmitted diseases (STD) caused by the bacterium Neisseria gonorrhoeae. Untreated gonorrhea may lead to complications such as pelvic inflammatory disease (PID), epididymitis, or even life-threatening blood infections. It is estimated that more than 700,000 persons each year were infected with gonorrhea in this country. [1] In 2006, the rate of reported gonorrheal infections was 120.9 cases per 100,000 persons, [2] which far exceed the Healthy People 2010 goal to reduce gonorrhea incidence to 19 per 100,000 population.[3] • Richmond City is a metropolitan area located in the center region of Virginia. It has been recognized with consistently the highest gonorrhea rates in Virginia. [4] In 2006, Richmond's gonorrhea rate was 458.3 cases per 100,000; this is about five times the state average of 85.5 cases per 100,000 persons and four times the national average. [2,5] • Gonorrhea infections, similar to other types of infectious diseases, do not follow the random pattern of occurrence spatially. Identification of areas with elevated disease burdens could greatly enhance the efficacy and effectiveness of sexually transmitted infections (STIs) prevention for public health agencies. • Using geographic mapping to describe the distribution of STDs has gained increased attention in the arena of public health. [6-11] As early studies indicated, the transmission of gonorrhea depends on relative small proportion of a population named “core groups”, [12-14] which are composed of geographically clustered repeated cases.[9] • Reported gonorrhea diagnoses (n=9,979) between 2000 and 2007 in the city of Richmond, Virginia were extracted. Among the reported cases, 584 cases (6 percent) were excluded due to the missing addresses. Among those with a residential address, approximately 93.2 percent (8756 cases) were successful geocoded. The cases that could not be geocoded included those with post office addresses, uncompleted or other unlocatable addresses or non residential addresses, such as jails, juvenile detention center, veteran affairs medical care, shelter, homeless etc. Additional exclusion criteria for this analysis were cases with a reported residential address outside the geographic boundary of Richmond City, representing 1.2 percent (104 cases) of 8756 cases, and 9 cases younger than age 10, representing 0.1 percent of cases (Figure 1). b Demographics TABLE 1. Demographic characteristics of reported cases of gonorrhea in Richmond City, Virginia, 2000-2007 (N=8643). The most likely cluster Materials & Methods • A. Data Extraction and Geocoding • As an infectious disease, gonorrhea is mandated by state law to be reported to the city/county health department within three days of suspected or confirmed diagnosis. Health departments and private providers in Virginia use an Epi-1 form (the Virginia Department of Health Confidential Morbidity Report) to report each gonorrhea case. All collected information was input into the STD Management Information System (STDMIS) database at the Virginia Department of Health (VDH). • Reported cases from January, 2000 to December, 2007, from Richmond city, Virginia, were extracted from STDMIS. Each case was geocoded to its reported residential address by using Census GeoStanTM version 1.0. Geocoding produced x-and y-coordinates for valid addresses and these coordinates were used to construct incidence maps. • A gonorrhea case is defined as positive for Neisseria gonorrhoeae confirmed by laboratory examination of penile, vaginal, urethral, rectal or pharyngeal specimen using a nucleic acid amplification test. This analysis excluded cases with age of 10 years and under at diagnosis, since these patients were not routinely considered being infected through their risky sex behaviors. • B. Mapping • Cases were mapped onto a layer file containing Richmond city’s block groups by using ArcMap version 9.2. The layer file was downloaded from the U.S. census TIGER/LINE shape files. Gonorrhea incidence rates were calculated as the number of reported cases in the block group divided by the population of the block group. Census Bureau estimates for the population of each census block group in 2000 was the denominator. • C. Spatial Statistics Analysis • Spatial scan analysis was used to identify high gonorrhea rate clusters using indirect standardization method. Under the null hypothesis, the incidence of gonorrhea follows a Poisson distribution, and the probability of a case being diagnosed in a particular block group is proportional to the age-adjusted population in the block group. Cases in each block group were further stratified into five age groups (10-14, 15-19, 20-24, 25-39, and above 39). Since the only block group level population data available from the U.S. census web site were those stratified by gender and age in very small intervals (from 0 to 85 and over), variables were downloaded and merged to obtain values for a larger age groups. Population at risk was set as 10% of the block group population. Monte Carlo procedure was fixed as 9999 random replications. The largest secondary cluster • By using SaTScan adjusting for age groups, seven statistically significant (p <0.0001) high gonorrhea clusters (core areas) were identified. As indicated in Figure 4, these clusters comprised 72 of the total 163 block groups and covered approximately 39 percent of total city areas. • The mostly likely cluster was located on the northeast part of Richmond City. It comprised 15 census block groups and spanned 2.85 square miles (7.38 km2) with an annual incidence rate of 1449.4 per 100,000. Cases occurred in this cluster represented 21 percent (1084 cases) of the total number of gonorrhea cases in Richmond over 8 years. • Among the six secondary clusters identified, the largest cluster was about 11.95 square miles (30.95 km2) on the southeast side of the City, which comprised 26 block groups, 16 percent of the total 163 block groups analyzed. This core area was responsible for 19.3 percent or 1668 cases over the 8 years, had an average rate of 1237.7 per 100,000. The relative risk of this cluster is 2.214. The second largest cluster was located in the northern part of Richmond City. It included 22 block groups and spanned 5.70 square miles (14.76 km2) with an annual rate of disease of 795.9. The relative risk within this cluster was 1.310 with an observed number of 1048 cases diagnosed during 2000-2007, compared with 823 expected cases. The third largest cluster was recognized as a sole block group also located in the northern part, with an area of 1.52 square miles (3.94 km2). Although it is merely responsible for 0.6 percent of the total cases, the relative risk was high (RR=2.870). • Of the total number of cases, 85.9% were under the age of 35, and 84.9% were Black. Females account for about 52.9% of all cases. The average of the subjects was 24.8 ±9.1 years (Table 1). Conclusion • The study has shown the presence of seven clusters of gonorrhea in Richmond, Virginia. Out of these seven clusters detected in the analysis, three covers fair large areas. The study has also demonstrated that using the existing health data, the spatial scan statistic and GIS can provide public health agencies with necessary feed back about the prevalence of statistically significant clusters of gonorrhea in the region, and thus enabling them to design more effective strategy to contain this scope. Further analysis will be focused on determine the most important risk factors which affect disease distributions. • The average yearly rate of gonorrhea in Richmond City was 681 cases per 100,000. Figure 2. indicated the temporal trend of the reported gonorrhea cases. The highest incidence rate per block group is 22,794 per 100,000, with the mean of 8634 cases per 100,000. Figure 3 showed the most gonorrhea cases resided in the east side of the city, with high incidence rate associated with approximately 32 block groups.
Gonorrhea Education
Clusters identified by spatial scan statistics using SaTScan The second largest cluster Most likely cluster The largest cluster
Spatial Analysis of Gonorrhea Incidencein Richmond, Virginia, 2000-2007
What is Geocoding? Street Database • Address: • 920 Main St. • Richmond, VA 23220 905 Main St. X1, Y1 910 Main St. X2, Y2 920 Main St. X3, Y3 930 Main St. X4, Y4 940 Main St. X5, Y5 • Longitude (X3):-77.451723 • Latitude (Y3):37.550164
John Snow 0139 Vibrio cholerae Dr. Richmond, VA, 23231
Reporting Form Address: 0139 Vibrio Cholerae Dr. Richmond, VA, 23231 Henrico Richmond Morbidity
Independent cities In Virginia, under state constitutional changes after the American Civil War (1861-1865), beginning in 1871, cities became politically independent of the counties. For many practical purposes, an independent city in Virginia since then has been comparable to a county. Many agencies of the U.S. Government consider Virginia's independent cities to be county-equivalents. http://en.wikipedia.org/wiki/Lost_counties%2C_cities%2C_and_towns_of_Virginia#Independent_cities
Virginia is divided into independent cities and counties, which function in the same manner. According to the US Census Bureau, independent cities are considered county-equivalent.[58] Under Virginia law, all municipalities incorporated as cities are independent of any county. As of 2006, thirty-nine of the forty-two independent cities in the United States are in Virginia. Virginia does not have any political subdivisions, such as villages or townships, for areas of counties that are not within the boundaries of incorporated towns. There are hundreds of other unincorporated communities in Virginia, sometimes informally called towns.[59] http://en.wikipedia.org/wiki/Virginia#Cities_and_towns
Business Process Flowchart for Geocoding STD Morbidity: City of Richmond, Chesterfield County and Henrico County, Virginia – 2006.
Net Gonorrhea and Chlamydia Morbidity Reassignment Percentages: City of Richmond, Chesterfield County and Henrico County: 2002-2006
*Non-geocodable cases (n=471) were retained within the city/county of initial morbidity report and are included in the redistributed case counts for each city/county above. Hence, the total Reported Cases and Redistributed Cases are equal. ^ The Tri-City/County Richmond Area is comprised of the city of Richmond and the counties of Chesterfield and Henrico. Distribution of Gonorrhea and Chlamydia Based on Geocoded Morbidity Assignments in the Tri-city/county Richmond Area^, 2006
Ranking of Richmond, VA, based on National Summary of Gonorrhea and Chlamydia Rates among Cities >200,000 Population: 1992-2004* * Data in this table was extracted from annual CDC Sexually Transmitted Disease Surveillance reports 9-21 ‡ Data from 1992-1995 for chlamydia rankings is based on non-rank tables requiring manual calculation † The Virginia Department of Health initiated increased chlamydia screening criteria (6/7/1995)22 †† Geocoding was implemented for all data beginning in January 2002
Check it out! Stover, J., Kheirallah, K., Delcher, C., Dolan, C., Johnson, L. Improving Surveillance of Sexually Transmitted Diseases Through Geocoded Morbidity Assignment Public Health Reports - OASIS Suppl. Nov/Dec 2009. Vol 124. No. 5.
Data Confidentiality • Geo-masking • moving the point locations • Transformations: • Translation: shift all points a fixed distance and direction • Scale: expand or contract all points by a scaling factor • Rotation: rotate all points by a fixed angle about a pivot point • Random perturbation: • Relocate randomly from original • Most commonly used method • Maps for public release – equivalent visual pattern • Where is the point? • Is it now in a lake? • Urban vs rural • Aggregation • Loss of geographic information • Artificial boundaries • Assumed homogeneity • Reverse geocoding • 432 of 550 (79%) patients in Boston • Brownstein et al NEJM 2006
Random Perturbation in a GIS Original Geomasked Detail Stinchcomb, D.
Confidentiality GIS is fairly new to STD surveillance Technology has outpaced confidentiality standards Is geocoded and/or mapped data easily identifiable? Use of rates, ranges, etc. Randomization of points, offsets Need to establish guidance for users and recipients Data sharing agreements
Cromley and McLafferty, Guilford Press 2002. “Mapping communicable diseases at detailed geographic scales raises significant concerns about privacy and confidentiality.”
“CDC recommends that data be released in the form that is closest to microdata and that still preserves confidentiality.” CDC/ATSDR Policy on Releasing and Sharing Data
CDC Comments on Disclosure of Confidential Information “Those assessing the risk that confidential information will be disclosed should recommend the statistical methods to be used for disclosure protection (e.g. suppression, random perturbations, recoding, top- or bottom-coding.) The recommended methods should balance the risk of disclosure against the possibility that reducing the risk of disclosure will also reduce the usefulness of the data for public health practice and research.” This requires staff trained to assess such risks.
From CDC Guidelines for HIV/AIDS Surveillance, Appendix C: Security and Confidentiality “Geographic information systems (GIS) allow for relatively accurate dot-mapping. Care must be taken that graphic (like numeric) presentation of data cannot permit the identification of any individual by noting pinpoint observations of HIV cases at, for example, the county, ZIP code, or census tract level.” “Generally speaking, only aggregated HIV/AIDS surveillance data should be released outside the HIV/AIDS surveillance unit through published reports, grant applications, grant progress or planning reports, correspondence, newsletters, public meeting, or press releases.”