Download

1 / 35
360 likes | 480 Views
Understand and implement the normalization process to optimize database tables, reduce redundancies, and eliminate data anomalies. Learn about the stages of normalization and ensure efficient data storage.

E N D
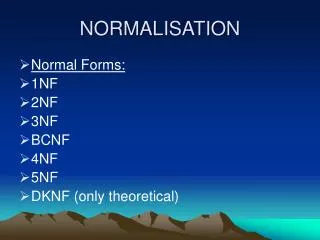
Database Tables and Normalization • Normalization • Process for evaluating and correcting table structures to minimize data redundancies • Reduces data anomalies • Works through a series of stages called normal forms: • First normal form (1NF) • Second normal form (2NF) • Third normal form (3NF)
Database Tables and Normalization (continued) • Normalization (continued) • 2NF is better than 1NF; 3NF is better than 2NF • For most business database design purposes, 3NF is as high as we need to go in normalization process • Highest level of normalization is not always most desirable
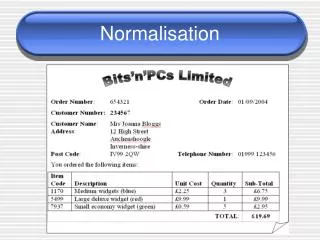
The Need for Normalization • Example: Company that manages building projects • Charges its clients by billing hours spent on each contract • Hourly billing rate is dependent on employee’s position • Periodically, report is generated that contains information displayed in Table 7.1
The Normalization Process • Each table represents a single subject • No data item will be unnecessarily stored in more than one table • All attributes in a table are dependent on the primary key
Conversion to First Normal Form • Repeating group • Derives its name from the fact that a group of multiple entries of same type can exist for any single key attribute occurrence • Relational table must not contain repeating groups • Normalizing table structure will reduce data redundancies • Normalization is three-step procedure
Conversion to First Normal Form (continued) • Step 2: Identify the Primary Key • Primary key must uniquely identify attribute value • New key must be composed
Conversion to First Normal Form (continued) • Step 3: Identify All Dependencies • Dependencies can be depicted with help of a diagram • Dependency diagram: • Depicts all dependencies found within given table structure • Helpful in getting bird’s-eye view of all relationships among table’s attributes • Makes it less likely that will overlook an important dependency
Conversion to First Normal Form (continued) • First normal form describes tabular format in which: • All key attributes are defined • There are no repeating groups in the table • All attributes are dependent on primary key • All relational tables satisfy 1NF requirements • Some tables contain partial dependencies • Dependencies based on only part of the primary key • Sometimes used for performance reasons, but should be used with caution • Still subject to data redundancies
Conversion to Second Normal Form • Relational database design can be improved by converting the database into second normal form (2NF) • Two steps
Conversion to Second Normal Form (continued) • Step 1: Write Each Key Component on a Separate Line • Write each key component on separate line, then write original (composite) key on last line • Each component will become key in new table
Conversion to Second Normal Form (continued) • Step 2: Assign Corresponding Dependent Attributes • Determine those attributes that are dependent on other attributes • At this point, most anomalies have been eliminated
Conversion to Second Normal Form (continued) • Table is in second normal form (2NF) when: • It is in 1NF and • It includes no partial dependencies: • No attribute is dependent on only portion of primary key
Conversion to Third Normal Form • Data anomalies created are easily eliminated by completing three steps • Step 1: Identify Each New Determinant • For every transitive dependency, write its determinant as PK for new table • Determinant • Any attribute whose value determines other values within a row
Conversion to Third Normal Form (continued) • Step 2: Identify the Dependent Attributes • Identify attributes dependent on each determinant identified in Step 1 and identify dependency • Name table to reflect its contents and function
Conversion to Third Normal Form (continued) • Step 3: Remove the Dependent Attributes from Transitive Dependencies • Eliminate all dependent attributes in transitive relationship(s) from each of the tables that have such a transitive relationship • Draw new dependency diagram to show all tables defined in Steps 1–3 • Check new tables as well as tables modified in Step 3 to make sure that each table has determinant and that no table contains inappropriate dependencies
Conversion to Third Normal Form (continued) • A table is in third normal form (3NF) when both of the following are true: • It is in 2NF • It contains no transitive dependencies
Normalization and Database Design • Normalization should be part of design process • Make sure that proposed entities meet required normal form before table structures are created • Many real-world databases have been improperly designed or burdened with anomalies if improperly modified during course of time • You may be asked to redesign and modify existing databases
Normalization and Database Design (continued) • ER diagram • Provides big picture, or macro view, of an organization’s data requirements and operations • Created through an iterative process • Identifying relevant entities, their attributes and their relationship • Use results to identify additional entities and attributes
Normalization and Database Design (continued) • Normalization procedures • Focus on characteristics of specific entities • Represents micro view of entities within ER diagram • Difficult to separate normalization process from ER modeling process • Two techniques should be used concurrently
Summary • Normalization is technique used to design tables in which data redundancies are minimized • First three normal forms (1NF, 2NF, and 3NF) are most commonly encountered • Table is in 1NF when all key attributes are defined and when all remaining attributes are dependent on primary key
Summary (continued) • Table is in 2NF when it is in 1NF and contains no partial dependencies • Table is in 3NF when it is in 2NF and contains no transitive dependencies • Table that is not in 3NF may be split into new tables until all of the tables meet 3NF requirements • Normalization is important part—but only part—of design process