Download
1 / 46
460 likes | 590 Views
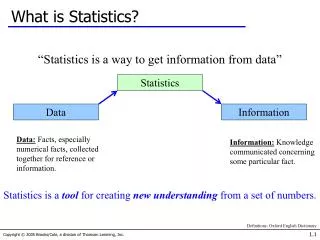
1st. Business and Economic Statistics Tutorial 1: Describing Categorical Data ( Ch 4). Tutor: Sam Capurso E-mail :. 1. Why Statistics?. Initiates policy / decisions. Statistics. Evaluates and informs policy / decisions. Accountants work in an economy (in fact, everyone does).

E N D
1st Business and Economic StatisticsTutorial 1: Describing Categorical Data (Ch 4) Tutor: Sam Capurso E-mail: ...
1. Why Statistics? Initiates policy / decisions Statistics Evaluates and informs policy / decisions Accountants work in an economy (in fact, everyone does) Confidence More... i P E.R. Business Consumer
3. First prac (only) * Introduction * “House keeping” * Arrange groups * Work out team names and take attendance * Prac work
4. Things to note • * Need to attend lectures and read text BEFORE PRAC • * Assessment for pracs = • Indiv MCQ (5%)^ + Team MCQ (5%)^ + Team WAQ (10%)^^ • ^ Hand in prac • ^^ Hand in by due date: …in hand-in box: names, ID numbers, time, day, tutor.
Roles • Architect – design, framework, ideas • Tradesperson – technical, 'expert' in field • Superintendent – leader, knowledge of different areas • Decorator – finer details, user-friendliness • Real estate agent – communication, 'sells the product' • General contractor – follows direction, able to learn how to perform different roles
Task Questions: • Why did you choose this role? • What types of skills / experiences are related to this role? • What are the ways in which someone in your role can work with someone from (choose a different role)? • How can you relate this activity to working in your BES team?
2nd Note Stratified and clustered sampling Clip: http://www.youtube.com/watch?v=CvPPM2stuPg&feature=c4-overview&list=UUZFQ2rSVMR2ahKAzBto5P7w
Sampling: Undercoverage Convenience sampling Note: n↑ ≠ ↓bias n↑ ↓sampling error (error due to randomness) Need to improve survey design to bias If ↑ n, just asking more people the wrong question! Non-response bias Voluntary response bias Response bias
2nd E.g. Simpson’s Paradox
School A has more girls in each year level So, something must be going on with year levels when we add them up to get results before.
Category summed Characteristic Category summed Group
3rd Note Displaying and Describing Quantitative Data
3rd Note Displaying and Describing Quantitative Data
3rd E.g. Displaying and Describing Quantitative Data • Construct a box-and-whisker plot for the following data: 3, 8, 1, 5, 3, -2, 3 • Solution: • Ordered: -2, 1, 3, 3, 3, 5, 8 • Median: 3 • Q1: 2 • Q3: 4 • IQR: 4 – 2 = 2 • 1.5 * IQR = 3 • LF = Q1 – 3 = -1 • UF= Q3 + 3 = 7 • So, whiskers at 1 and 5, outliers are -2 and 8
4th Note Interpretation of slope coefficient Clip: http://www.youtube.com/watch?v=BgCoGYXwD4w&list=UUZFQ2rSVMR2ahKAzBto5P7w
4th E.g. Correlation and Linear Regression • The difference between r (correlation coefficient) and R2 (the coefficient of determination)… • The difference between interpreting r and commenting on a scatter plot… • Question – True or false? Two variables which are strongly related will always have a high correlation coefficient. Explain… • Is this point unusual? What to do…
E.g. 5th Probability and Expected Values Be aware of the following: *V[X + c] ≠ V[X] + c * SD[X + Y] ≠ SD[X] + SD[Y]; = V Var[X] + Var[Y] * where X, Y are random variables, c is a constant. * Note the two tests for independence… * Interpretation of expected value: we expect ….(include units)… in the long run, on average.
E.g. 5th Probability and Expected Values • Questions: • Find the formula for P(A or B) if A and B are: independent; not independent. • Find the formula for P(A and B) if A and B are: disjoint; not disjoint. • Consider disjoint events A and B, which both have non-zero probabilities. Can A and B ever be independent? Explain in words or using formulae. • Complete the following: E[aX+bY + c]; Var[aX+bY + c], • where a, b are constants, and X, Y are independent random variables
E.g. 5th Probability and Expected Values Consider a single trial with two outcomes, success (which we will represent by a 1) or failure (0). Let the probability of success be p. What is the probability of failure? Hint: you need to make sure the probability model is valid. Write down the formula for calculating the expected value. Use this to work out E(y) in terms of p. Write down the formula for calculating variance. Use this to show Var(y) = p(1-p). Solutions
Note 6th Normal and sampling distributions • http://www.youtube.com/watch?v=ddBdqqtXiao&feature=c4-overview&list=UUZFQ2rSVMR2ahKAzBto5P7w • The four types of normal probability questions: • P(X < A) • P(A < X < B) = P(X < B) – P(X < A) • P(X > B) = P(X < -B) = 1 – P(X < B) • Given the probability, what are the boundaries? Because Z tables only have < probs
E.g. 6th Normal distribution The length, X cm, of members of a certain species of fish is normally distributed with mean 40 and standard deviation 5. • Find the probability that a fish is longer than 45 cm. • Find the probability that a fish is between 35 cm and 50 cm long. • Describe the longest 10% of this specifies of fish. Solutions
Note 7th Confidence intervals and hypothesis tests Proportions • Confidence intervals for proportions: + z • Remember to check conditions • Interpretation: we are 95% confident the population proportion lies between [lower bound] and [upper bound] • n =
Note 7th Confidence intervals and hypothesis tests Means • CI: + t where s = sample standard deviation and where t has df = n – 1 • Remember to check conditions • Similar interpretation…
Note 7th Confidence intervals and hypothesis tests Hypothesis tests of one proportion • Hypothesis test: one-tailed (< >) or two-tailed • Conditions • State model using (z or t) • Standardised statistic • P-value (or… learn other way this week, ‘critical value’ approach) • Conclusion
7th E.g. Hypothesis test: 1 proportion Historically, 53% of the population supported the ruling political party. A recent survey, in which the 150 respondents were selected randomly, showed that 93 of them supported the party. A two-tailed z-test at the 0.05 level of significance is to be used to determine whether or not the population proportion has significantly changed. • State the null hypothesis and the alternative hypothesis. • Check the conditions that justify inference in this context. • Determine whether or not the null hypothesis should be rejected, and make a conclusion based on your finding. Handwritten solution
Note 8th Inference so far… reviewing the p-value
Note 8th Inference so far…
Note 8th Inference so far… hypothesis tests for counts
8th E.g. Hypothesis test: 1 mean • Previous research has shown that the average IQ of Australians was 110. In 2012, a random sample of 40 Australians revealed an average IQ of 100 with standard deviation 15. The researcher wants to test, at a 1% level of significance, whether the average IQ of Australians has indeed decreased. • (Fictional data) Handwritten solution
Note 9th Excel Output
Note 9th Inference in regression
Note 9th Inference in regression
Note 9th Inference in regression
9th E.g. Inference in regression We are estimating the relationship between bwght (birth weight of newborn baby in pounds) and cigs (packets of cigarettes smoked per week by mother prior to birth). Consider the Excel output below and answer the following questions.
9th E.g. • Which do you think is the explanatory variable and which is the response variable? • Write down and interpret the correlation coefficient. • Write down and interpret R2 (the coefficient of determination). • Interpret the slope and the intercept. • Are the signs and sizes of the slope and intercepts reasonable? Explain. • Write down and interpret the 95% confidence interval for the slope. • Do the same for the 90% confidence interval. Explain how this differs from the 95% confidence interval. • Formulate a null and alternative hypothesis for the slope, using economic or general theory. • Conduct this hypothesis test using a 5% level of significance and make a conclusion. • Test whether the slope is significantly different from -0.05 at a 1% level of significance. • Suppose a hypothesis test for the slope had hypotheses H0: β1 = 0, and HA: β1≠0. Explain the purpose of conducting this test in terms of assessing whether the current regression model should be used.
Note 10th Notation - recap:
Note 10th Multiple Linear Regression; Dummy Variables; Time Series – some things to note Multiple linear regression • Interpretation of slope coefficient: we estimate for every [one unit] increase in [explanatory variable], the [response variable][increases/decreased] by [… units], on average, holding all other explanatory variables fixed. • Inference on the whole equation • H0: β1 = β2 = … = 0 no linear relationship between Y and X1, X2,… • HA: β1≠ 0 and/or β2≠ 0 • at least one of the slopes is significant; there is a significant relationship between the response variable and the explanatory variables as a group. • Use p-value from Excel “Significance-F”
Note 10th Multiple Linear Regression; Dummy Variables; Time Series – some things to note Dummy variables • Interpretation of dummy variables… see example. • The dummy variable trap… • Testing the significance of a dummy variable is the same as testing whether there is a significant difference between the means of the two categories. Time Series • Interpretation of trend line, trend = a + bt • Trend is [a units] at [origin] and [increases / decreases] by [b units] each [time period, t].
10th E.g. Dummy Variables • Consider the following equation: • Income = β0 + β1experience + β2gender + ε • where gender = 1 if male, 0 if female. • State what you expect the sign of β1 and β2 to be. Explain why. • Interpret the following: • The slope coefficient on gender. • The slope coefficient on experience. • Redefine gender to be 1 if female, 0 if male. What happens to β2? • Suppose that we want to examine the level of crime in different regions of Adelaide: north, south, east and west. In other words, in our regression model, crime level is the response variable, and region is the explanatory variable. Create a dummy variable for the region. Solutions – for 2
Note 11th Time Series and Price Indices • Price relative = 100* • Be careful about the difference between a percentage increase and percentage point increase. Assume a, b > 100 • Interpretation: price index of A means prices are (a – 100)% higher in Year A than in the base year / there has been a (a – 100)% increase • The increase in the index number from Year A to Year B is (b – a) percentage points or… • % • Note: you could do the same using prices, instead of price indices. • Interpretation of average price relatives: on average, the price of the … goods increased by …% between … and … (*) • Could do the same for expenditure … … but of little use. • Same interpretation, but instead of “price” use “cost”.
Note 11th Time Series and Price Indices • Laspeyres Price Index = . This is the increase in the cost of the time 0 basket of goods in time t relative to what they cost in time 0. • Paasche Price Index = = . This is the increase in the cost of the time t basket of goods in 2010 relative to what they would have cost in 2008. • Same interpretation as (*) • Note: • Why the Laspeyres and Paasche Indices differ. • How to shift the base, and chain series. • Nominal = in current prices. Real = in constant (base year prices) • Real prices = (if price index base = 100)
Note 11th Time Series and Price Indices Discussion question – what are the limitations of the CPI? • Overestimates price index because there is a type of Laspeyres index • What items are included in the goods basket? (Can’t include all of them!) • Only surveys metropolitan households • Data taken from survey – potential sources of sampling bias • Does not account for change in quality in goods with same / lower price (e.g. computers) • How do you include new technology that didn’t exist in the previous period? • What prices do you take? CPI doesn’t take into account sales / specials