Download

1 / 41
610 likes | 1.16k Views
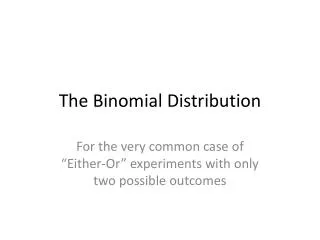
The Binomial Distribution. It’s binomial when you have…. A fixed number of observations (trials), n e.g., 15 tosses of a coin; 20 patients; 1000 people surveyed A binary random variable e.g., head or tail in each toss of a coin; defective or not defective light bulb

E N D
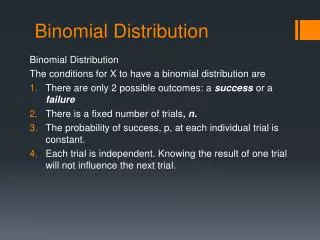
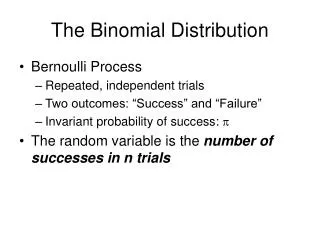
It’s binomial when you have… • A fixed number of observations (trials), n • e.g., 15 tosses of a coin; 20 patients; 1000 people surveyed • A binary random variable • e.g., head or tail in each toss of a coin; defective or not defective light bulb • Generally called “success” and “failure” • Probability of success is p, probability of failure is 1 – p • Constant probability for each observation • e.g., Probability of getting a tail is the same each time we toss the coin
Binomial example Take the example of 5 coin tosses. What’s the probability that you flip exactly 3 heads in 5 coin tosses?
Binomial example Solution: One way to get exactly 3 heads: HHHTT What’s the probability of this exact arrangement? P(heads)xP(heads) xP(heads)xP(tails)xP(tails) =(1/2)3x(1/2)2 Another way to get exactly 3 heads: THHHT Probability of this exact outcome = (1/2)1x (1/2)3x(1/2)1 = (1/2)3x(1/2)2
Binomial example In fact, (1/2)3x(1/2)2 is the probability of each unique outcome that has exactly 3 heads and 2 tails. So, the overall probability of 3 heads and 2 tails is: (1/2)3x(1/2)2 + (1/2)3x(1/2)2+ (1/2)3x(1/2)2+ ….. for as many unique arrangements as there are—but how many are there??
Outcome Probability THHHT (1/2)3x(1/2)2 HHHTT (1/2)3x(1/2)2 TTHHH (1/2)3x(1/2)2 HTTHH (1/2)3x(1/2)2 HHTTH (1/2)3x(1/2)2 HTHHT (1/2)3x(1/2)2 THTHH (1/2)3x(1/2)2 HTHTH (1/2)3x(1/2)2 HHTHT (1/2)3x(1/2)2 THHTH (1/2)3x(1/2)2 HTHHT (1/2)3x(1/2)2 10 arrangements x (1/2)3x(1/2)2 The probability of each unique outcome (note: they are all equal) ways to arrange 3 heads in 5 trials 5C3 = 5!/3!2! = 10
P(3 heads and 2 tails) = x P(heads)3 x P(tails)2 = 10 x (½)5=31.25%
Binomial distribution function:X= the number of heads tossed in 5 coin tosses p(x) p(x) x 0 1 3 4 5 2 number of heads number of heads
Example 2 As voters exit the polls on Feb. 5 (Presidential Primary day in CA!), you ask a representative random sample of 6 Democrat voters if they voted for Hillary. If the true percentage of all Democrats who vote for Hillary on Feb. 5 is 55.1%, what is the probability that, in your sample, exactly 2 voted for Hillary and 4 did not?
ways to arrange 2 Hillary votes among 6 voters P(2 yes votes exactly) = x (.551)2x(.449)4= 18.5% Solution: Outcome Probability HHNNNN (.551)2x(.449)4 = (.551)2x(.449)4 NHHNNN (.449)1x (.551)2x(.449)3= (.551)2x(.449)4 NNHHNN (.449)2x (.551)2x(.449)2= (.551)2x(.449)4 NNNHHN (.449)3x (.551)2x(.449)1= (.551)2x(.449)4 NNNNHH (.449)4x (.551)2= (.551)2x(.449)4 HNNNNH (.551)1x (.449)4 x(.551)1= (.551)2x(.449)4 …etc. 15 arrangements x (.551)2x(.449)4
n = number of trials 1-p = probability of failure p = probability of success X = # successes out of n trials Binomial formula Note the general pattern emerging if you have only two possible outcomes (call them 1/0 or yes/no or success/failure) in n independent trials, then the probability of exactly X “successes”=
Summary • Binomial: Suppose that n independent experiments, or trials, are performed, where n is a fixed number, and that each experiment results in a “success” with probability p and a “failure” with probability 1-p. The total number of successes, X, is a binomial random variable with parameters n and p. • We write: X ~ Bin (n, p) {reads: “X is distributed binomially with parameters n and p} • And the probability that X=r (i.e., that there are exactlyr successes) is:
Definitions: Bernouilli Bernouilli trial: If there is only 1 trial with probability of success p and probability of failure 1-p, this is called a Bernouilli distribution. (special case of the binomial with n=1) Probability of success: Probability of failure:
Binomial distribution: example • If I toss a coin 20 times, what’s the probability of getting exactly 10 heads?
Binomial distribution: example • If I toss a coin 20 times, what’s the probability of getting of getting 2 or fewer heads?
Note: the variance will always lie between 0*N-.25 *N p(1-p) reaches maximum at p=.5 P(1-p)=.25 **All probability distributions are characterized by an expected value and a variance: IfX follows a binomial distribution with parameters n and p: X ~ Bin (n, p) Then: x= E(X) = np x2 =Var (X) = np(1-p) x2 =SD (X)=
Characteristics of Bernouilli distribution For Bernouilli (n=1) E(X) = p Var (X) = p(1-p)
For Y~Bernouilli (p) Y=1 if yes Y=0 if no Bonus (optional!): Variance Proof For X~Bin (N,p)
Practice problems • 1. You are performing a cohort study. If the probability of developing disease in the exposed group is .05 for the study duration, then if you sample (randomly) 500 exposed people, how many do you expect to develop the disease? Give a margin of error (+/- 1 standard deviation) for your estimate. • 2. What’s the probability that at most 10 exposed people develop the disease?
Answer 1. You are performing a cohort study. If the probability of developing disease in the exposed group is .05 for the study duration, then if you sample (randomly) 500 exposed people, how many do you expect to develop the disease? Give a margin of error (+/- 1 standard deviation) for your estimate. X ~ binomial (500, .05) E(X) = 500 (.05) = 25 Var(X) = 500 (.05) (.95) = 23.75 StdDev(X) = square root (23.75) = 4.87 25 4.87
Answer 2. What’s the probability that at most 10 exposed subjects develop the disease? This is asking for a CUMULATIVE PROBABILITY: the probability of 0 getting the disease or 1 or 2 or 3 or 4 or up to 10. P(X≤10) = P(X=0) + P(X=1) + P(X=2) + P(X=3) + P(X=4)+….+ P(X=10)= (later you’ll learn how to approximate this long sum in a jiffy)
A brief distraction: Pascal’s Triangle Trick You’ll rarely calculate the binomial by hand. However, it is good to know how to … Pascal’s Triangle Trick for calculating binomial coefficients Recall from math in your past that Pascal’s Triangle is used to get the coefficients for binomial expansion… For example, to expand: (p + q)5 The powers follow a set pattern: p5 + p4q1 + p3q2 + p2q3+ p1q4+ q5 But what are the coefficients? • Use Pascal’s Magic Triangle…
Edges are all 1’s 1 1 1 1 2 1 1 3 3 1 1 4 6 4 1 1 5 10 10 5 1 1 6 15 20 15 6 1 1 7 21 35 35 21 7 1 To get the coefficient for expanding to the 5th power, use the row that starts with 5. Add the two numbers in the row above to get the number below, e.g.: 3+1=4; 5+10=15 (p + q)5 = 1p5 + 5p4q1 + 10p3q2 + 10p2q3+ 5p1q4+ 1q5 Pascal’s Triangle
X P(X) 0 1 2 3 4 5 From line 5 of Pascal’s triangle! Same coefficients for X~Bin(5,p) For example, X=# heads in 5 coin tosses:
P(X=0) P(X=1) P(X=2) P(X=3) P(X=4) P(X=5) Relationship between binomial probability distribution and binomial expansion
Practice problem If the probability of being a smoker among a group of cases with lung cancer is .6, what’s the probability that in a group of 8 cases you have fewer than 2 smokers? More than 5? What are the expected value and variance of the number of smokers?
Answer 1 1 1 1 2 1 1 3 3 1 1 4 6 4 1 1 5 10 10 5 1 1 6 15 20 15 6 1 1 7 21 35 35 21 7 1 1 8 28 56 70 56 28 8 1
0 7 1 2 3 4 5 6 8 Answer, continued
P(>5)=.21+.09+.0168 = .3168 P(<2)=.00065 + .008 = .00865 0 7 1 2 3 4 5 6 8 Answer, continued E(X) = 8 (.6) = 4.8 Var(X) = 8 (.6) (.4) =1.92 StdDev(X) = 1.38
Practice problem If Stanford tickets in the medical center ‘A’ lot approximately twice a week (2/5 weekdays), if you want to park in the ‘A’ lot twice a week for the year, are you financially better off buying a parking sticker (which costs $603 for the year) or parking illegally (tickets are $35 each)?
Answer If Stanford tickets in the medical center ‘A’ lot approximately twice a week (2/5 weekdays), if you want to park in the ‘A’ lot twice a week for the year, are you financially better off buying a parking sticker (which costs $603 for the year) or parking illegally (tickets are $35 each)? Use Binomial Let X be a random variable that is the number of tickets you receive in a year. Assuming 2 weeks vacation, there are 50x2 days (twice a week for 50 weeks) you’ll be parking illegally. p=.40 is the chance of receiving a ticket on a given day: X~bin (100, .40) E(X) = 100x.40 = 40 tickets expected (with std dev of about 5) 40 x $35 = $1400 in tickets (+/- $200); better to buy the sticker!
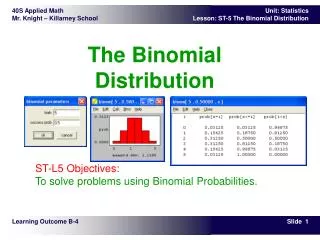
Calculating binomial probabilities in SAS For binomial probability distribution function: P(X=C) = pdf('binomial', C, p, N) For binomial cumulative distribution function: P(X≤C) = cdf('binomial', C, p, N)
Starting to have a normal shape even with fairly small n. You can imagine that if n got larger, the bars would get thinner and thinner and this would look more and more like a continuous function, with a bell curve shape. Here np=4.8. .27 0 7 1 2 3 4 5 6 8 Normal approximation to the binomial When you have a binomial distribution where n is large and p isn’t too small (rule of thumb: mean>5), then the binomial starts to look like a normal distribution Recall: smoking example…
.27 0 7 1 2 3 4 5 6 8 Normal approximation to binomial What is the probability of fewer than 2 smokers? Exact binomial probability (from before) = .00065 + .008 = .00865 Normal approximation probability: =4.8 =1.39 P(Z<2)=.022
A little off, but in the right ballpark… we could also use the value to the left of 1.5 (as we really wanted to know less than but not including 2; called the “continuity correction”)… A fairly good approximation of the exact probability, .00865. P(Z≤-2.37) =.0069
Practice problem 1. You are performing a cohort study. If the probability of developing disease in the exposed group is .25 for the study duration, then if you sample (randomly) 500 exposed people, What’s the probability that at most 120 people develop the disease?
By hand (yikes!): P(X≤120) = P(X=0) + P(X=1) + P(X=2) + P(X=3) + P(X=4)+….+ P(X=120)= + … + + Answer P(Z<-.52)= .3015 OR Use SAS: data _null_; Cohort=cdf('binomial', 120, .25, 500); put Cohort; run; 0.323504227 OR use, normal approximation: =np=500(.25)=125 and 2=np(1-p)=93.75; =9.68
Proportions… • The binomial distribution forms the basis of statistics for proportions. • A proportion is just a binomial count divided by n. • For example, if we sample 200 cases and find 60 smokers, X=60 but the observed proportion=.30. • Statistics for proportions are similar to binomial counts, but differ by a factor of n.
Differs by a factor of n. Differs by a factor of n. P-hat stands for “sample proportion.” Stats for proportions For binomial: For proportion:
It all comes back to Z… • Statistics for proportions are based on a normal distribution, because the binomial can be approximated as normal if np>5