Download
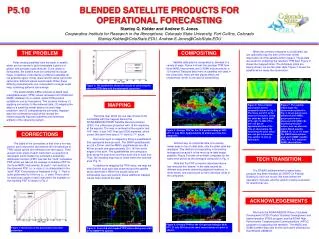
1 / 19
190 likes | 346 Views
Utilizing SODAR for 4DWX and Operational Forecasting. Dave Noble Meteorology Intern Cold Regions Test Center July 2007. Introduction. What is the Sodar? Basic Sodar concepts using the Scintec XFAS system as an example Why use it? How can it be used for ATEC ranges? General Forecasting

E N D
Utilizing SODAR for 4DWX and Operational Forecasting Dave Noble Meteorology Intern Cold Regions Test Center July 2007
Introduction • What is the Sodar? • Basic Sodar concepts using the Scintec XFAS system as an example • Why use it? • How can it be used for ATEC ranges? • General Forecasting • Example of a UAV test at CRTC • Chinook wind example • Implementation to 4DWX (NIMA, ARMADA) • What are the considerations and challenges? • Noise considerations • Other setup considerations • Wind Problems at CRTC • Support challenges • Conclusions • Questions
Sodar Explanation • Sodar = Sound Detection and Ranging • Measures a three-dimensional profile of wind speed and direction as well as turbulence characteristics in the lower atmosphere. • “Sodars operate on the principle of acoustic back-scattering. Electronic sound drivers (transducers) are used to generate acoustic pulses that are directed into the atmosphere. As the sound wave propagates through the atmosphere, a small fraction of that energy is scattered by small-scale temperature inhomogeneities whose scale is similar to that of the wavelength of the acoustic pulse. These temperature inhomogeneities are produced by turbulence in regions of larger-scale potential temperature gradients, inversion layers, wind shear layers, or thermal plumes produced by surface heating. A receiver on the surface acquires and amplifies the backscattered signal. ” (Crescenti, 1997)
Scintec XFAS Sodar1 • The Scintec XFAS Sodar is a mono-static phased array instrument • Digitally-controlled phased array containing 52 electro-magnetic pressure chamber transducer elements capable of simultaneous emission and reception of acoustic signals • Each transducer contains audio power drivers for emission up to 10 frequencies (from 830 to 1370 Hz) and audio preamplifiers for reception mode all within one pulse sequence cycle • Acoustic beams can be emitted in up to 9 directions • Analog signal processing performed by SPU • Converts analog to digital return signals • Calculates real-time Fourier transforms (To compute mean frequency of backscattered signals) • Controls hardware functions 1 Information acquired from Scintec Hardware Manual v 0.67
Why use it? • Radiosonde expensive to use when measuring continuous ABL conditions • Materials and man-hours costly ($100/sonde) • Radiosonde data can be negatively affected by wind shear, pendulum swings, etc. • Incapable of describing meteorological variables directly above location • Relatively inexpensive compared to wind profilers • The vertical range of Sodar can be as high as 2 km! • Many scientific applications • Wind flow in complex terrain, low-level jets, frontal passages, mixed layer heights • Sensible heat flux, turbulence parameters, Pasquill-Gifford stability classes (Crescenti, 1997)
UAV Test at CRTC(12pm on August 2006) • Models and MOS revealed light winds for the day • 4DWX showed light south winds (<5 kts) for the afternoon • Radiosonde (blue line) at Texas Range revealed Chinook winds were present above 1600 ft AGL. • Sodar (red line) located at Mississippi Range several miles from TX Range also revealed the same feature but speeds not as great Wind Speed (kts) Wind Direction Height (ft AGL.)
Chinook Example Wind Speed vs. Height Time-series for May 30, 2007 at Mississippi Range ~45 mph Warm colors are higher speeds in m/s
Chinook Example Wind Direction vs. Height Time-series for May 30, 2007 at Mississippi Range Green = 90° Orange = 180°
Chinook Example Vertical Velocity vs. Height Time-series for May 30, 2007 at Mississippi Range Upward W
4DWX System • Tabular dataset storage into ARMADA
Ingest of NIMA QC data into RTFDDA NIMA = NCAR Improved Moments Algorithm “NIMA is based on the idea that a human looking at a 2d view of the spectral contours can discern the atmospheric signal from the noise and clutter primarily because the atmospheric signal is continuous over height…”1 Cory Morse is endeavoring to apply NIMA to our Sodar data. She has had difficulty retrieving raw spectra from Scintec data due to software upgrades. Scintec is coming out with new software this fall that should fix the issue. 1 C. Morse, personal communication, April 2007.
Noise Considerations • Needs a quiet environment because it evaluates acoustic backscatter signals that have small amplitudes • Acoustic enclosure recommended: pieces of sheet metal coated with sound absorbing foam on one side to help reduce ambient noise near the ground (i.e., machines and engines, traffic, airplanes and wind at obstacles) • If set up near public areas, sound volume can be reduced at night but degrades output resolution
Other Set-up Considerations • Processing unit and power supply must be shielded from the elements to prevent overheating and condensation • In areas where gusts over 40 mph are possible, cement enclosures (or other secure enclosures) are recommended • Measures should be taken to protect Sodar units from lightning strikes
Wind Problems Chinook wind event with gusts up to 45 mph brought damage to Sodar enclosure connected by guy wires at CRTC:
Solution to High Winds Sodar and enclosure securely bolted to wooden deck with guy wires and ratchet straps:
Support Challenges • Better technical support and hardware diagnostics needed • Many ATEC ranges have Sodars that are not working • Sodar companies are small and do not have extensive customer support • When hardware parts break: • Software diagnosis is not very good • Shipping costs can be factors in preventing a fix • A possible solution to hardware support: • Purchase a 2nd set of parts when ordering Sodar unit1 • One Canadian company bought a whole new set of parts with their Scintec system. • Enables easier hardware troubleshooting. 1 Scintec Todd Reed, personal communication, July 2007
Conclusion • The Sodar is a promising instrument for deriving 3-D wind speed and direction for boundary layer applications. • It has shown to be a useful tool for short-range forecasts at CRTC. • The Scintec XFAS Sodar is on the verge of being the next observation system to be ingested into the 4DWX data assimilation system, RTFDDA through NIMA. • The Sodar still has problems related to ambient noise, atmospheric effects, hardware issues and poor technical and customer support.
References and Resources Bailey, Desmond T. [6 1987] (2 2000). “Upper-air Monitoring”, Meteorological Monitoring Guidance for Regulatory Modeling Applications, John Irwin, Research Triangle Park, NC: United States Environmental Protection Agency, pp. 9-9 to 9-11. EPA-454/R-99-005. Cohn, S.A., R.K. Goodrich, C.S. Morse, E. Karplus, S. Mueller, L.B. Cornman, and R.A. Weekley, 2001: “Radial velocity and wind measurements with NIMA: Comparisons with human estimation and aircraft measurements”, J. Applied Meteorology, 40, p 704-719. Cornman, L.B., R.K. Goodrich, C.S. Morse, and W.L. Ecklund, 1998: A fuzzy logic method for improved moment estimation from Doppler spectra. J.Atmos.Oceanic Technol., 15, 1287-1305 Coulter, R. L., 1997: “Turbulence Variables derived from Sodar data”, Acoustic Remote Sensing Applications (ed. S.P. Singal). New Dehli, Narosa Publ. House, p 191-201. Cresenti, G.H., 1997: “A look back on Two Decades of Doppler Sodar Comparison Studies”, Bull. Amer. Meteorol. Soc., 78, p 651-673. Moore, K.E., and B.H. Bailey, 2002:”SODAR For Wind Resource Assessment”, Presentation to American Wind Energy Association. September, 2005, found on http://www.iedat.com/sodar.html. Morse, C. S., R. K. Goodrich, and L.B. Cornman, 2002: “The NIMA Method for Improved Moment Estimation from Doppler Spectra”, J.Atmospheric and Oceanic Technology, 19, p 274-295. Pichugina, Y., R. M. Banta, and N. D. Kelley, 2006: “Analysis of the southern Colorado Low-Level Jet by High Resolution Lidar data. Comparison to Great Plains LLJ climatologies.”, Third Symposium on LIDAR Atmospheric Applications. Retrieved May 20, 2007, from http://ams.confex.com/ams/87ANNUAL/techprogram/paper_119093.htm. Schindler, D., 2004:”Characteristics of the Atmospheric Boundary Layer over a Scots Pine Forest”, Retrieved May 25, 2007, from http://www.meteo.uni-freiburg.de/forschung/publikationen/berichte/bericht11.pdf. Scintec, 2006: Scintec Flat Array Sodars Hardware Manual (Revision 0.67).