Download
1 / 1
10 likes | 25 Views
Axis Direct presents daily derivatives report presenting recommendations based on technical analysis. For trading in derivatives visit https://simplehai.axisdirect.in/offerings/products/derivatives<br>https://simplehai.axisdirect.in/share-stock-prices/nse/Bharat-Petroleum-Corporation-Ltd-2290<br>https://simplehai.axisdirect.in/share-stock-prices/nse/Sun-Pharmaceuticals-Industries-Ltd-4325<br>https://simplehai.axisdirect.in/share-stock-prices/nse/Tata-Motors-Ltd-560

E N D
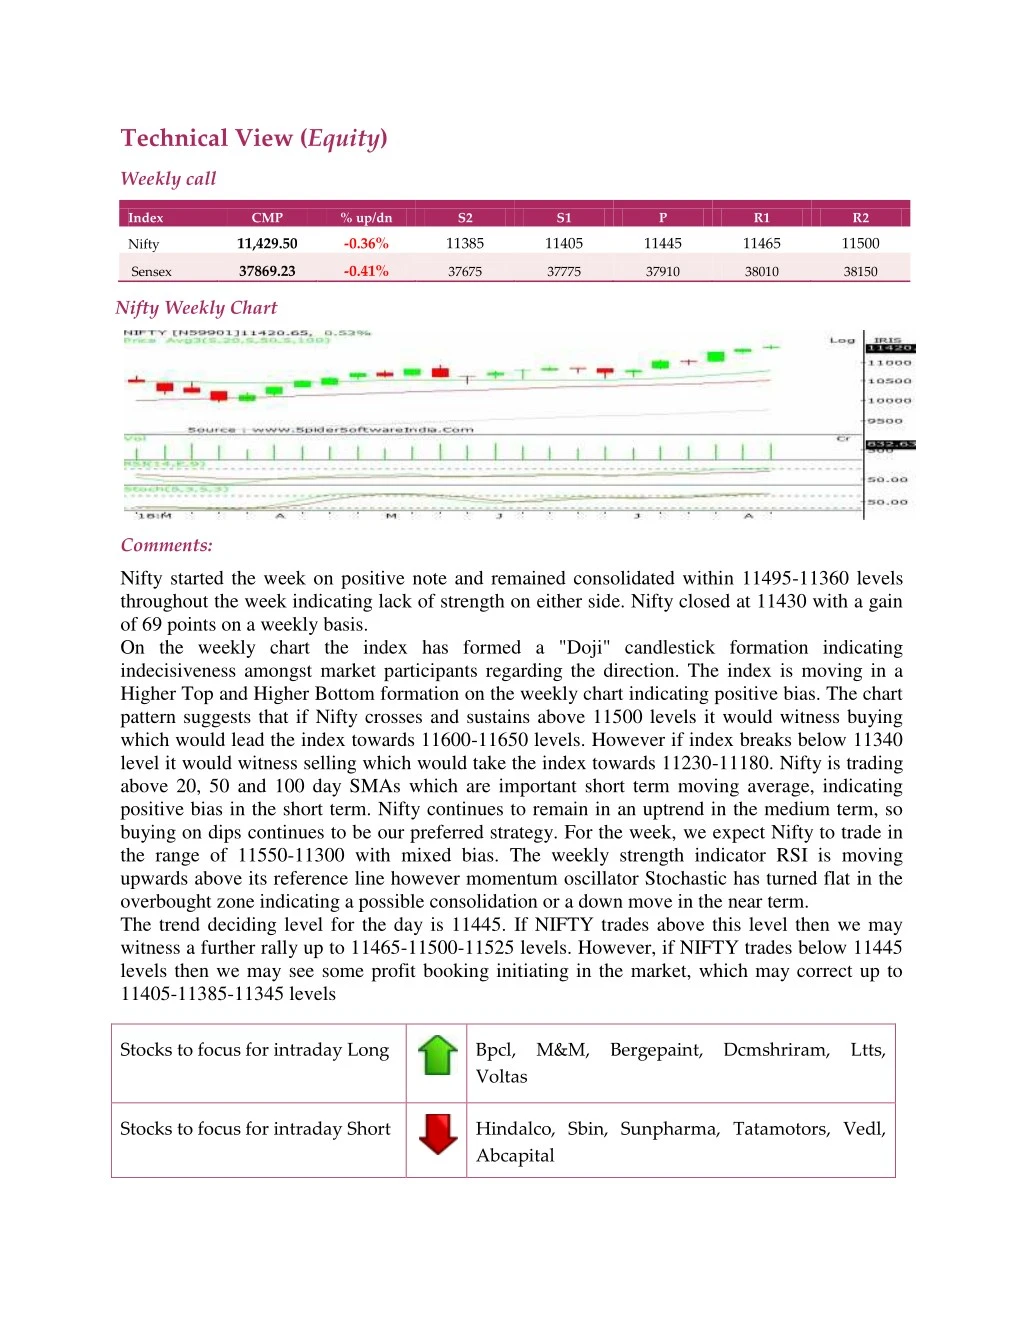
Technical View (Equity) Weekly call Index CMP % up/dn S2 S1 P R1 R2 11,429.50 -0.36% 11385 11405 11445 11465 11500 Nifty 37869.23 -0.41% Sensex 37675 37775 37910 38010 38150 Nifty Weekly Chart Comments: Nifty started the week on positive note and remained consolidated within 11495-11360 levels throughout the week indicating lack of strength on either side. Nifty closed at 11430 with a gain of 69 points on a weekly basis. On the weekly chart the index has formed a "Doji" candlestick formation indicating indecisiveness amongst market participants regarding the direction. The index is moving in a Higher Top and Higher Bottom formation on the weekly chart indicating positive bias. The chart pattern suggests that if Nifty crosses and sustains above 11500 levels it would witness buying which would lead the index towards 11600-11650 levels. However if index breaks below 11340 level it would witness selling which would take the index towards 11230-11180. Nifty is trading above 20, 50 and 100 day SMAs which are important short term moving average, indicating positive bias in the short term. Nifty continues to remain in an uptrend in the medium term, so buying on dips continues to be our preferred strategy. For the week, we expect Nifty to trade in the range of 11550-11300 with mixed bias. The weekly strength indicator RSI is moving upwards above its reference line however momentum oscillator Stochastic has turned flat in the overbought zone indicating a possible consolidation or a down move in the near term. The trend deciding level for the day is 11445. If NIFTY trades above this level then we may witness a further rally up to 11465-11500-11525 levels. However, if NIFTY trades below 11445 levels then we may see some profit booking initiating in the market, which may correct up to 11405-11385-11345 levels Stocks to focus for intraday Long Bpcl, M&M, Bergepaint, Dcmshriram, Ltts, Voltas Stocks to focus for intraday Short Hindalco, Sbin, Sunpharma, Tatamotors, Vedl, Abcapital