Download
1 / 1
10 likes | 23 Views
Axis Direct presents daily derivatives report presenting recommendations based on technical analysis. For trading in derivatives visit https://simplehai.axisdirect.in/offerings/products/derivatives

E N D
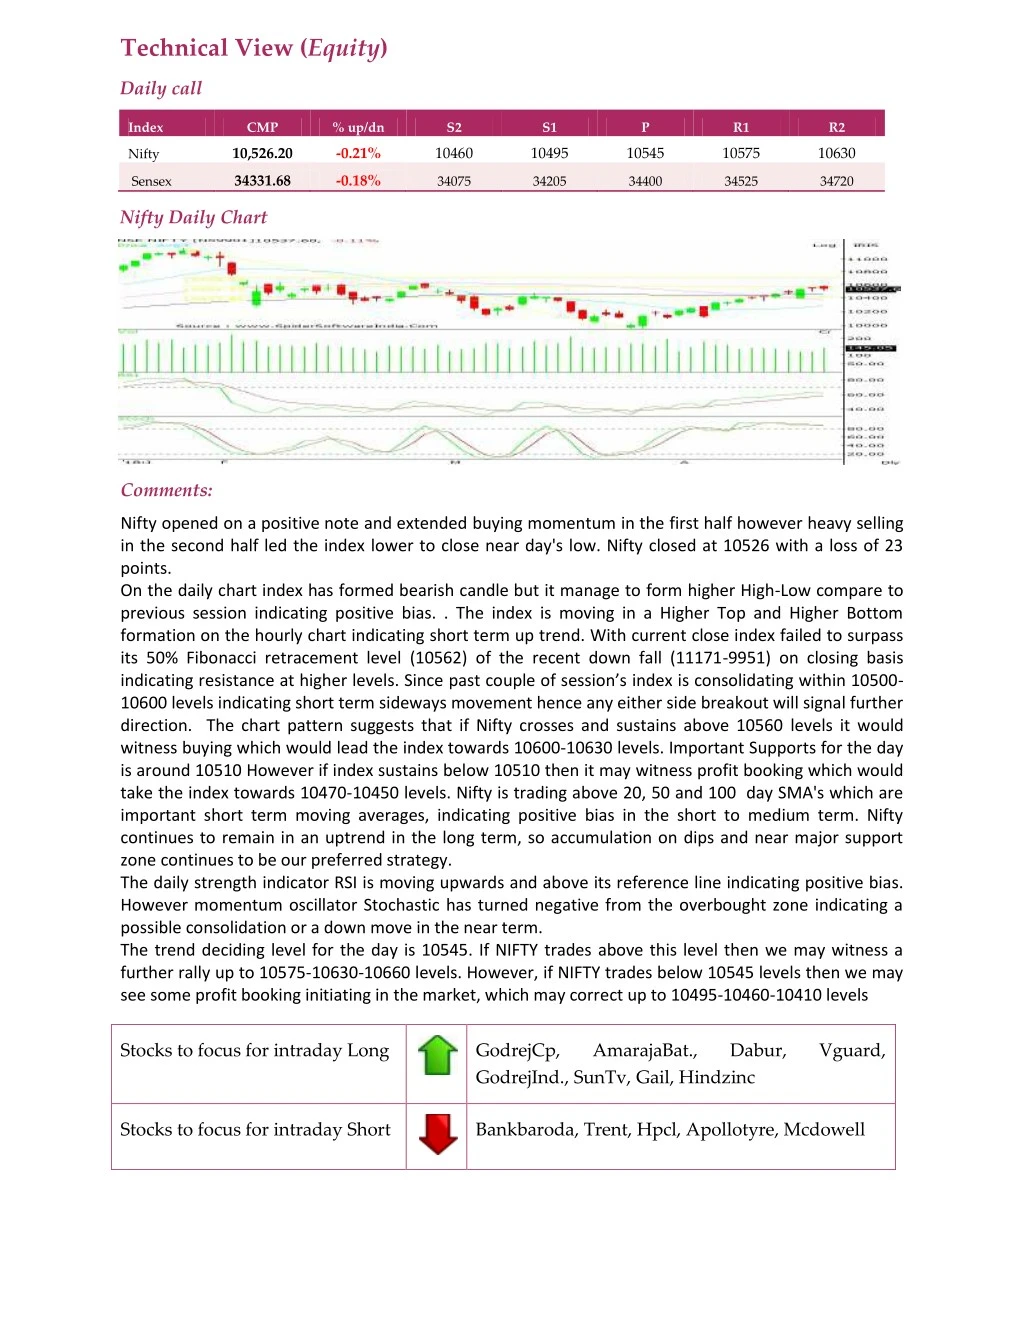
Technical View (Equity) Daily call Index CMP % up/dn S2 S1 P R1 R2 10,526.20 -0.21% 10460 10495 10545 10575 10630 Nifty 34331.68 -0.18% Sensex 34075 34205 34400 34525 34720 Nifty Daily Chart Comments: Nifty opened on a positive note and extended buying momentum in the first half however heavy selling in the second half led the index lower to close near day's low. Nifty closed at 10526 with a loss of 23 points. On the daily chart index has formed bearish candle but it manage to form higher High-Low compare to previous session indicating positive bias. . The index is moving in a Higher Top and Higher Bottom formation on the hourly chart indicating short term up trend. With current close index failed to surpass its 50% Fibonacci retracement level (10562) of the recent down fall (11171-9951) on closing basis indicating resistance at higher levels. Since past couple of session’s index is consolidating within 10500- 10600 levels indicating short term sideways movement hence any either side breakout will signal further direction. The chart pattern suggests that if Nifty crosses and sustains above 10560 levels it would witness buying which would lead the index towards 10600-10630 levels. Important Supports for the day is around 10510 However if index sustains below 10510 then it may witness profit booking which would take the index towards 10470-10450 levels. Nifty is trading above 20, 50 and 100 day SMA's which are important short term moving averages, indicating positive bias in the short to medium term. Nifty continues to remain in an uptrend in the long term, so accumulation on dips and near major support zone continues to be our preferred strategy. The daily strength indicator RSI is moving upwards and above its reference line indicating positive bias. However momentum oscillator Stochastic has turned negative from the overbought zone indicating a possible consolidation or a down move in the near term. The trend deciding level for the day is 10545. If NIFTY trades above this level then we may witness a further rally up to 10575-10630-10660 levels. However, if NIFTY trades below 10545 levels then we may see some profit booking initiating in the market, which may correct up to 10495-10460-10410 levels Stocks to focus for intraday Long GodrejCp, GodrejInd., SunTv, Gail, Hindzinc AmarajaBat., Dabur, Vguard, Stocks to focus for intraday Short Bankbaroda, Trent, Hpcl, Apollotyre, Mcdowell