Download
1 / 2
20 likes | 26 Views
Axis Direct presents daily derivatives report presenting recommendations based on technical analysis. For trading in derivatives visit https://simplehai.axisdirect.in/offerings/products/derivatives

E N D
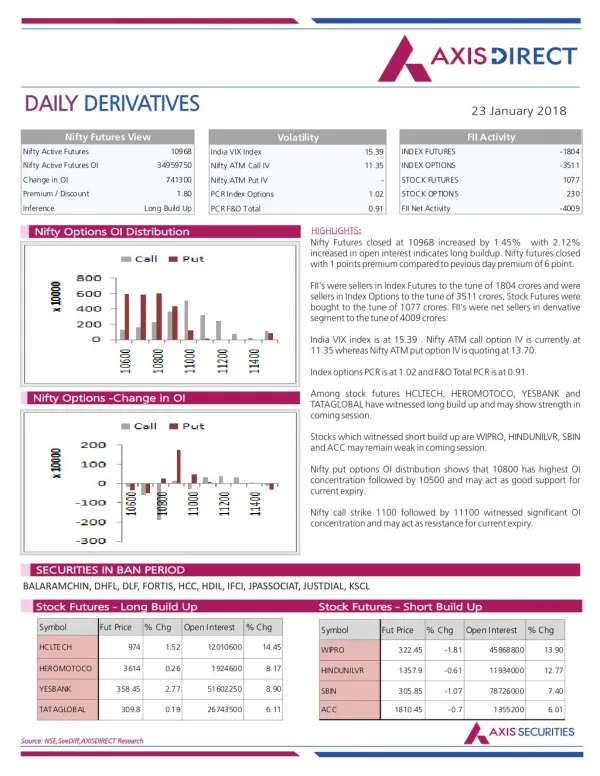
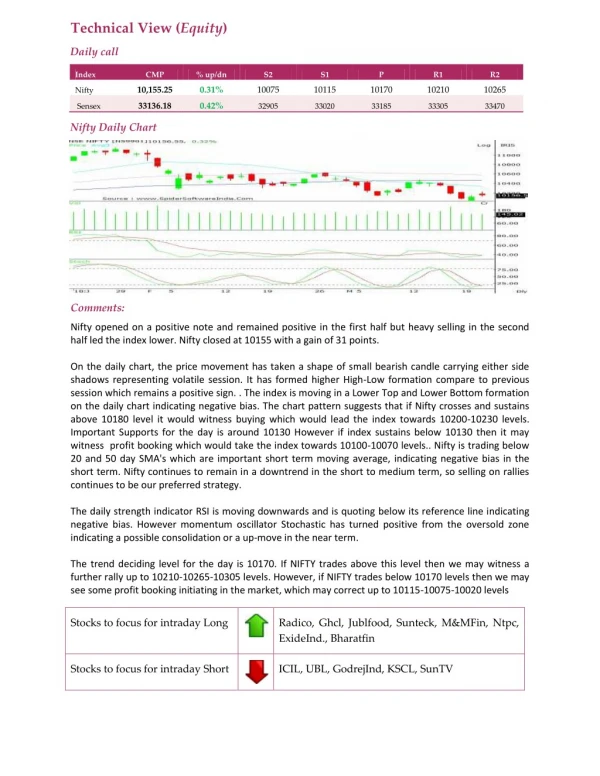
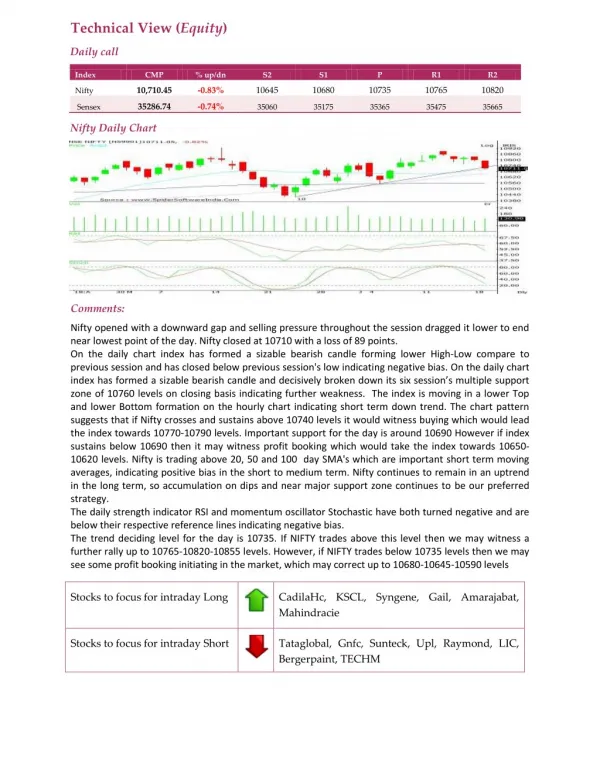
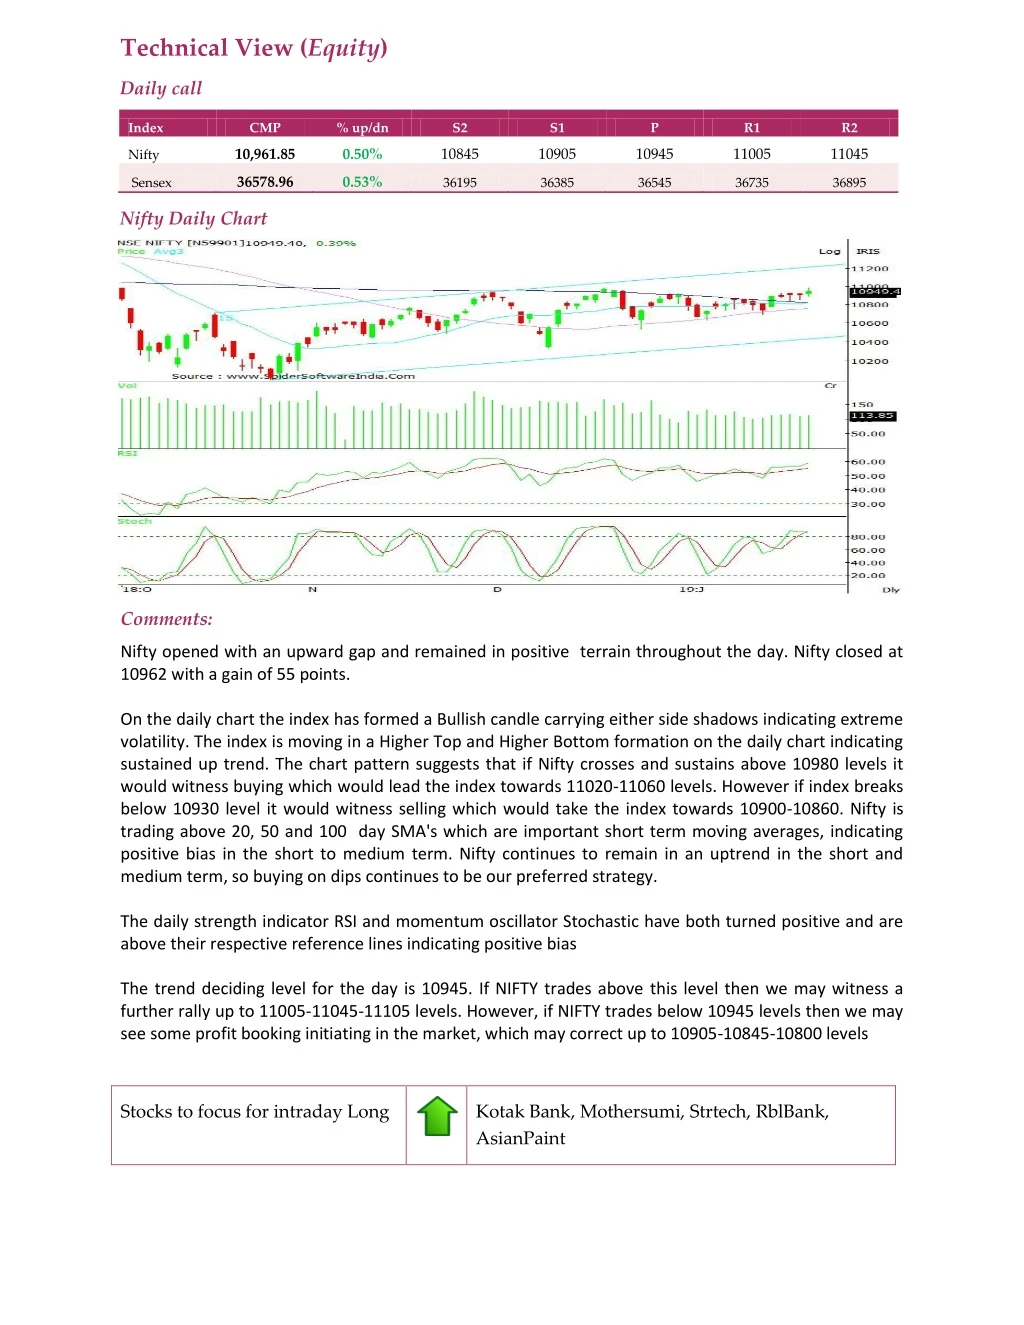
Technical View (Equity) Daily call Index CMP % up/dn S2 S1 P R1 R2 10,961.85 0.50% 10845 10905 10945 11005 11045 Nifty 36578.96 0.53% Sensex 36195 36385 36545 36735 36895 Nifty Daily Chart Comments: Nifty opened with an upward gap and remained in positive terrain throughout the day. Nifty closed at 10962 with a gain of 55 points. On the daily chart the index has formed a Bullish candle carrying either side shadows indicating extreme volatility. The index is moving in a Higher Top and Higher Bottom formation on the daily chart indicating sustained up trend. The chart pattern suggests that if Nifty crosses and sustains above 10980 levels it would witness buying which would lead the index towards 11020-11060 levels. However if index breaks below 10930 level it would witness selling which would take the index towards 10900-10860. Nifty is trading above 20, 50 and 100 day SMA's which are important short term moving averages, indicating positive bias in the short to medium term. Nifty continues to remain in an uptrend in the short and medium term, so buying on dips continues to be our preferred strategy. The daily strength indicator RSI and momentum oscillator Stochastic have both turned positive and are above their respective reference lines indicating positive bias The trend deciding level for the day is 10945. If NIFTY trades above this level then we may witness a further rally up to 11005-11045-11105 levels. However, if NIFTY trades below 10945 levels then we may see some profit booking initiating in the market, which may correct up to 10905-10845-10800 levels Stocks to focus for intraday Long Kotak Bank, Mothersumi, Strtech, RblBank, AsianPaint
Stocks to focus for intraday Short CanBank, RamcoCem, Maruti, SRF, DLF, Vguard