Download
1 / 6
60 likes | 183 Views
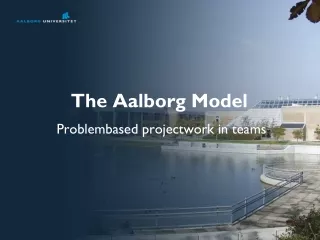
Comune di Ferrara UNESCO World Cultural Heritage. THE ENVIRONMENTAL BALANCE As Aalborg commitments monitoring tool. Paola Poggipollini. Ferrara: General Overview. 132.471 inhabitants 404.35 km 2 :13% urbanised-52% protected The economy is made up with : 64% Business and services

E N D
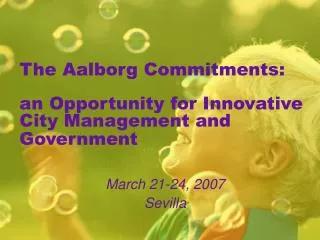
Comune di FerraraUNESCO World Cultural Heritage THE ENVIRONMENTAL BALANCEAs Aalborg commitments monitoring tool Paola Poggipollini
Ferrara: General Overview 132.471 inhabitants 404.35 km2:13% urbanised-52% protected The economy is made up with: 64% Business and services 18% Industries and SME: 4 EMAS, 15 ISO14001 18% agriculture 17.000 students at university Citizens’ actions for the environment: 26% of journeys by bicycle - 3% by bus 5.3ha is the ecological footprint of her inhabitants 7.19 ton/year is the CO2-emission for inhabitant (assessment 2002) 25.000 eq./in. heat by renewable energy Public Administration: 1.300 workers are employed in the Local Authority
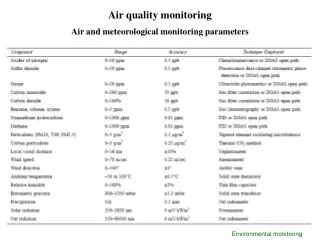
Environmen- tal Competence Natural Resources Indicators Definition Unit Reference Value (2004) Short Term Target 2005 Value 2005 Middle Term Target (year) Situation (population 2004 131.907) Green Public Areas Soil Green surface per inhabitants Public Green Areas in square metres per inhabitants (total) SM/in. 32,59 32,42 36,40 32,38 (2005) A new Municipal Structural Plan is going to be ratified Distance to middle term target +0,6% +0,1% +12,4% Sustainable Mobility Air Quality Concentration of benzene in the air Annual Average of Benzene Concentration μg/Nm3 4,2 4,9 3,7 5,0 (2010) Legal attention thresholds (10 μg/Nm3) are fully met Distance to middle term target +16 % +2% +26% Urban Development Soil Speed trend of urban growth Urbanised areas in square metres per year SM/year 169.577 (average 2001-04) 270.000 164.741 (average 2001/05) 270.000 (average 2001-2005) The General Regulatory Plan does not allow an annual programme Distance to medium term target +37,2% -0% +39% Water Resources Water Drawing of drinking water Cubic meter of spring and surface water for making it drinkable CM/in. 145,12 150,00 144,56 132 (2010) The trend of water consumption and drawings are decreasing Distance to medium term target -10 % -13,6 % -9,5 % Waste Raw Materials Waste Production Kg of Undifferentiat-ed Waste every week per inhabitants Kg/in./ week 8,99 9,07 8,67 9,76 (2005) The production of undifferentiated waste is decreasing. The total waste production is increasing Distance to middle term target +7,8% +7% +11%
Thank you for your attention For information: Agenda 21 Locale Tel. 0532-744657 E-mail: agenda21@comune.fe.it