Download
1 / 46
460 likes | 621 Views
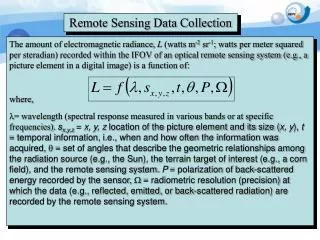
Remote Sensing and Internet Data Sources. Unit 3: Module 12, Lecture 2 – Remote Underwater Sampling Stations. Overview . Many kinds of remote sensing systems for water science involve sensor systems that remotely operated. These include: Buoy systems (RUSS units, National Buoy network)

E N D
Remote Sensing and Internet Data Sources Unit 3: Module 12, Lecture 2 – Remote Underwater Sampling Stations
Overview • Many kinds of remote sensing systems for water science involve sensor systems that remotely operated. These include: • Buoy systems (RUSS units, National Buoy network) • Towed or tethered systems • Sea floor mounted systems • Autonomous underwater vehicles
Background: RUSS and WOW • Remote Underwater Sampling Station technology developed at NRRI in mid-1990s • U. of MN creates Apprise Technologies, Inc. to market RUSS units and other sensors • 1996 – NSF Advanced Technology Education grant to create “Water on the Web” • Online curriculum incorporating real-time data from RUSS units into college-level lesson plans • 1999 – 2002 EPA EMPACT program funds Lake Access • Deliver real-time data to public • 2000 – WOW II – Water Science Technician Training • 2001 – DuluthStreams • Real-time stream monitoring
Remote monitoring systems for environmental data • RUSS unit – Remote Underwater Sampling Station • Real-time water quality data acquisition • Data transmitted to WOW web site “RUSS” Remote Underwater Sampling Station
Solar Panels Triple Hull (with electronics and power supply units) RUSS Design: Platform & Power Supply
Solar Panels Triple Hull (with electronics and power supply units) Profiler (Variable-buoyancy device) Multiprobe (sensor package) RUSS Design: Profiler
Profiler: Leveling device • Variable buoyancy • Will achieve target depth within 0.2 m • Typically set to collect data at 1 m intervals in water column
Profiler: Sensor package • Standard Hydrolab or YSI Sonde attached to Leveler • Measures • Temperature • pH • Dissolved Oxygen • Conductivity • Turbidity • Chl a
On-board Data Processing and Storage • Remote Programming, Data Acquisition and Retrieval (RePDAR) unit • CPU • Memory • Telemetry • Data is stored in ring memory on RePDAR • Profiles are stored in a data buffer • Can be downloaded on demand
Wireless Communications (cellular/RF/Satellite/900 MHz) Solar Panels Triple Hull (with electronics and power supply units) Profiler (Variable-buoyancy device) Multiprobe (sensor package) RUSS Design: Communications
Data Flow: RUSS unit to the WOW web site HTML EXCEL Data Importer Archive DVT
RUSS Programming • Sampling timing and frequency can be programmed from the base station computer • Data is broadcast back to the base station at user specified intervals (generally every 4 - 6 hours) • Data is stored in standard ASCII formats for import to spreadsheet or database programs
Data from RUSS units • 5-6 variables per depth • 10-20 depths per profile • 4 profiles per day
“Data hose” effect • 5-6 variables per depth • 10-20 depths per profile • 4 profiles per day • ~200 days per season • 96,000 points per lake • 4-6 lakes in WOW • 2-6 years worth of data 2,400,000 data points in archives
Online Data Visualization Tools • Profile plotter (parameters vs depth) • Color mapper (parameters vs depth) • DxT (depth vs time)
Data Visualization Tools: Profile Plotter • Accesses and plots individual profiles by parameter • Can ‘step through’ or animate time steps
Data Visualization Tools: DxT Profiler 2D visualizations: Temperature by Depth and Time
Data Visualization Tools: 3D Slicer 2D visualizations: Temperature by Depth and Time
Data Visualization Tools: DxT Profiler 2D visualizations: Temperature by Depth and Time Seasonal oxygen patterns Green - > 6 ppm O2 Brown – 3 – 6 ppm O2 – chronic stress Black - < 3 ppm O2 - lethal
Vandalism “I bet you can’t hit that yellow thing out in the water..”
Assuring Data Quality: Sensors • Hydrolab or YSI sondes need to be calibrated biweekly • Biofouling • “Drift” BeforeAfter (1 month)
July 1998 July 2001 Anomalous Conductivity Spike July 4, 1998 Ice Lake, MN “Several truckloads of salt”
In-stream sensor package connected to land-based power and data storage units No need for depth profile, but need information on stream flow Similar power and data management issues Stream Monitoring Units
SMU deployment • SMUs typically deployed near bridge abutments to allow easy access to stream • Note solar panel on pole • Good climbing skills required WOW staffer Jerry Hennick installing DuluthStreams SMU
Baseflow and post-storm differences in stream flow in Chester Creek, Duluth, MN
Hardwired SMUs • Ideal situation – obtain power and communications by tying into existing land lines • Duluth ship canal • USGS power supply and office facilities
Summary • RUSS and SMUs have formed the basis for the WOW on-line curriculum, as well as projects such as Lake Access and Duluth Streams • As on-line sensors become more widely used, there is a significant potential to use these systems for both public and student education • As a result, we should be more likely to use real data in making land and water management decisions