Download
1 / 59
590 likes | 670 Views
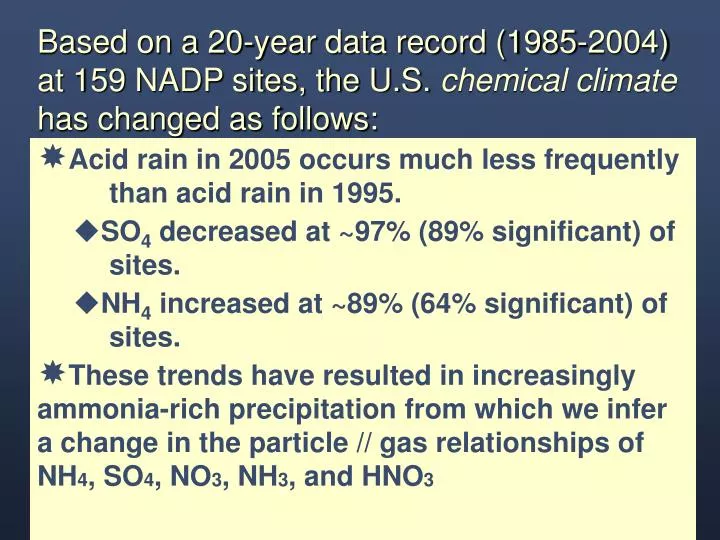
Based on a 20-year data record (1985-2004) at 159 NADP sites, the U.S. chemical climate has changed as follows:. Acid rain in 2005 occurs much less frequently than acid rain in 1995. SO 4 decreased at ~97% (89% significant) of sites. NH 4 increased at ~89% (64% significant) of sites.

E N D
Based on a 20-year data record (1985-2004) at 159 NADP sites, the U.S. chemical climate has changed as follows: • Acid rain in 2005 occurs much less frequently than acid rain in 1995. • SO4 decreased at ~97% (89% significant) of sites. • NH4 increased at ~89% (64% significant) of sites. • These trends have resulted in increasingly ammonia-rich precipitation from which we infer a change in the particle // gas relationships of NH4, SO4, NO3, NH3, and HNO3
Evaluating Trends(See: Lehmann, Bowersox, & Larson. 2005.Environmental Pollution. 135: 347-361.) • Precipitation-weighted-mean (high-V class & low-V class) seasonal concentrations • Seasonal Kendall Trend Test • Null Hypotheses: • Trend is zero (no trend) • Trends are homogeneous (same in every season) • Significance Level • p ≤ 0.1 for trend significance • p > 0.1 for homogeneity • Trend magnitude by Sen's Median Estimator
2002 - 2004 Frequency of Precipitation with pH < 5.0, 2002-2004
Sulfate Concentrations 1985 - 2002 84 85 86 87 88 89 90 91 92 93 94 95 96 97 98 99 00 01 02 03 National Atmospheric Deposition Program/National Trends Network
Sulfate Concentrations 1985 - 2002 84 85 86 87 88 89 90 91 92 93 94 95 96 97 98 99 00 01 02 03 National Atmospheric Deposition Program/National Trends Network
Sulfate Concentrations 1985 - 2002 84 85 86 87 88 89 90 91 92 93 94 95 96 97 98 99 00 01 02 03 National Atmospheric Deposition Program/National Trends Network
Sulfate Concentrations 1985 - 2002 8485 86 87 88 89 90 91 92 93 94 95 96 97 98 99 00 01 02 03 National Atmospheric Deposition Program/National Trends Network
Sulfate Concentrations 1985 - 2002 84 85 86 87 88 89 90 91 92 93 94 95 96 97 98 99 00 01 02 03 National Atmospheric Deposition Program/National Trends Network
Sulfate Concentrations 1985 - 2002 84 85 86 87 88 89 90 91 92 93 94 95 96 97 98 99 00 01 02 03 National Atmospheric Deposition Program/National Trends Network
Sulfate Concentrations 1985 - 2002 84 85 86 87 88 89 90 91 92 93 94 95 96 97 98 99 00 01 02 03 National Atmospheric Deposition Program/National Trends Network
Sulfate Concentrations 1985 - 2002 84 85 86 87 88 89 90 91 92 93 94 95 96 97 98 99 00 01 02 03 National Atmospheric Deposition Program/National Trends Network
Sulfate Concentrations 1985 - 2002 84 85 86 87 88 89 90 91 92 93 94 95 96 97 98 99 00 01 02 03 National Atmospheric Deposition Program/National Trends Network
Sulfate Concentrations 1985 - 2002 84 85 86 87 88 89 90 91 92 93 94 95 96 97 98 99 00 01 02 03 National Atmospheric Deposition Program/National Trends Network
Sulfate Concentrations 1985 - 2002 84 85 86 87 88 89 90 91 92 93 94 95 96 97 98 99 00 01 02 03 National Atmospheric Deposition Program/National Trends Network
Sulfate Concentrations 1985 - 2002 84 85 86 87 88 89 90 91 92 93 94 95 96 97 98 99 00 01 02 03 National Atmospheric Deposition Program/National Trends Network
Sulfate Concentrations 1985 - 2002 84 85 86 87 88 89 90 91 92 93 94 95 96 97 98 99 00 01 02 03 National Atmospheric Deposition Program/National Trends Network
Sulfate Concentrations 1985 - 2002 84 85 86 87 88 89 90 91 92 93 94 95 96 97 98 99 00 01 02 03 National Atmospheric Deposition Program/National Trends Network
Sulfate Concentrations 1985 - 2002 84 85 86 87 88 89 90 91 92 93 94 95 96 97 98 99 00 01 02 03 National Atmospheric Deposition Program/National Trends Network
Sulfate Concentrations 1985 - 2002 84 85 86 87 88 89 90 91 92 93 94 95 96 97 98 99 00 01 02 03 National Atmospheric Deposition Program/National Trends Network
Sulfate Concentrations 1985 - 2002 8485 86 87 88 89 90 91 92 93 94 95 96 97 98 99 00 01 02 03 National Atmospheric Deposition Program/National Trends Network
Sulfate Concentrations 1985 - 2002 84 85 86 87 88 89 90 91 92 93 94 95 96 97 98 99 00 01 02 03 National Atmospheric Deposition Program/National Trends Network
Sulfate Concentrations 1985 - 2002 84 85 86 87 88 89 90 91 92 93 94 95 96 97 98 99 00 01 02 03 National Atmospheric Deposition Program/National Trends Network
NADP/NTN Sulfate Trend 1985-2004 NADP/NTN Sulfate Trend 1985-2004 The National Trend -46% (median change) The National Trend -46% (median change)
35 30 25 20 Megatons/year 15 10 5 - 1970 1975 1980 1985 1990 1995 2000 2005 1985-2002 trend period SO2: - 40% (p < .001) Total Emissions Measured // Modeled SO2 NOx 1980 25.925 2002 15.353 NH3 Source: U.S. EPA
Nitrate Concentrations 1985 - 2002 84 85 86 87 88 89 90 91 92 93 94 95 96 97 98 99 00 01 02 03 National Atmospheric Deposition Program/National Trends Network
Nitrate Concentrations 1985 - 2002 84 85 86 87 88 89 90 91 92 93 94 95 96 97 98 99 00 01 02 03 National Atmospheric Deposition Program/National Trends Network
NADP/NTN Nitrate Trend 1985-2004 The National Trend -3% (median change)
35 30 25 20 Megatons/year 15 10 5 - 1970 1975 1980 1985 1990 1995 2000 2005 1985-2002 trend period NOx: - 13.4% (p < .001) Total Emissions Measured // Modeled SO2 NOx NH3 Source: U.S. EPA
NADP/NTN Ammonium Concentrations 1985 - 2002 84 85 86 87 88 89 90 91 92 93 94 95 96 97 98 99 00 01 02 03 National Atmospheric Deposition Program/National Trends Network
NADP/NTN Ammonium Concentrations 1985 - 2002 84 85 86 87 88 89 90 91 92 93 94 95 96 97 98 99 00 01 02 03 National Atmospheric Deposition Program/National Trends Network
NADP/NTN Ammonium Concentrations 1985 - 2002 84 85 86 87 88 89 90 91 92 93 94 95 96 97 98 99 00 01 02 03 National Atmospheric Deposition Program/National Trends Network
NADP/NTN Ammonium Concentrations 1985 - 2002 84 85 86 87 88 89 90 91 92 93 94 95 96 97 98 99 00 01 02 03 National Atmospheric Deposition Program/National Trends Network
NADP/NTN Ammonium Concentrations 1985 - 2002 84 85 86 87 88 89 90 91 92 93 94 95 96 97 98 99 00 01 02 03 National Atmospheric Deposition Program/National Trends Network
NADP/NTN Ammonium Concentrations 1985 - 2002 84 85 86 87 88 89 90 91 92 93 94 95 96 97 98 99 00 01 02 03 National Atmospheric Deposition Program/National Trends Network
NADP/NTN Ammonium Concentrations 1985 - 2002 84 85 86 87 88 89 90 91 92 93 94 95 96 97 98 99 00 01 02 03 National Atmospheric Deposition Program/National Trends Network
NADP/NTN Ammonium Concentrations 1985 - 2002 84 85 86 87 88 89 90 91 92 93 94 95 96 97 98 99 00 01 02 03 National Atmospheric Deposition Program/National Trends Network
NADP/NTN Ammonium Concentrations 1985 - 2002 84 85 86 87 88 89 90 91 92 93 94 95 96 97 98 99 00 01 02 03 National Atmospheric Deposition Program/National Trends Network
NADP/NTN Ammonium Concentrations 1985 - 2002 84 85 86 87 88 89 90 91 92 93 94 95 96 97 98 99 00 01 02 03 National Atmospheric Deposition Program/National Trends Network
NADP/NTN Ammonium Concentrations 1985 - 2002 84 85 86 87 88 89 90 91 92 93 94 95 96 97 98 99 00 01 02 03 National Atmospheric Deposition Program/National Trends Network
NADP/NTN Ammonium Concentrations 1985 - 2002 84 85 86 87 88 89 90 91 92 93 94 95 96 97 98 99 00 01 02 03 National Atmospheric Deposition Program/National Trends Network
NADP/NTN Ammonium Concentrations 1985 - 2002 84 85 86 87 88 89 90 91 92 93 94 95 96 97 98 99 00 01 02 03 National Atmospheric Deposition Program/National Trends Network
NADP/NTN Ammonium Concentrations 1985 - 2002 84 85 86 87 88 89 90 91 92 93 94 95 96 97 98 99 00 01 02 03 National Atmospheric Deposition Program/National Trends Network
NADP/NTN Ammonium Concentrations 1985 - 2002 84 85 86 87 88 89 90 91 92 93 94 95 96 97 98 99 00 01 02 03 National Atmospheric Deposition Program/National Trends Network
NADP/NTN Ammonium Concentrations 1985 - 2002 84 85 86 87 88 89 90 91 92 93 94 95 96 97 98 99 00 01 02 03 National Atmospheric Deposition Program/National Trends Network
NADP/NTN Ammonium Concentrations 1985 - 2002 84 85 86 87 88 89 90 91 92 93 94 95 96 97 98 99 00 01 02 03 National Atmospheric Deposition Program/National Trends Network
NADP/NTN Ammonium Concentrations 1985 - 2002 84 85 86 87 88 89 90 91 92 93 94 95 96 97 98 99 00 01 02 03 National Atmospheric Deposition Program/National Trends Network
NADP/NTN Ammonium Concentrations 1985 - 2002 84 85 86 87 88 89 90 91 92 93 94 95 96 97 98 99 00 01 02 03 National Atmospheric Deposition Program/National Trends Network