Download

1 / 7
70 likes | 260 Views
Finding the Mean and Standard Deviation Using the Calculator. Finding the Mean. To find the mean of a data set using the calculator put your data values in L 1 . After going back to the home screen bring up the LIST screen and move the cursor to highlight MATH .

E N D
Finding the Mean and Standard Deviation Using the Calculator
Finding the Mean • To find the mean of a data set using the calculator put your data values in L1. • After going back to the home screen bring up the LIST screen and move the cursor to highlight MATH. • Option 3 on the MATH screen is mean(. Choosing option 3 will return mean( to the screen. • Lastly, tell the calculator to find the mean of the data in L1 by entering L1 after mean( . Close the parentheses and press enter. The calculator will return the mean of the entries in L1.
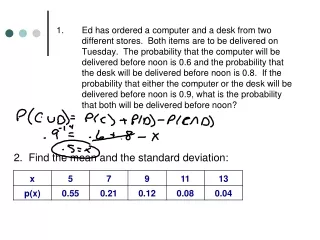
Finding the Mean of a Frequency Distribution • Often you have data expressed as a frequency distribution. If the data values are in L1 and the corresponding frequency values are in L2 finding the mean of the data involves more than finding the mean of the values in L1. If you find the mean of just the values in L1 you are not taking into account their frequencies. • In this case, select mean( from the LIST / MATH screen as before. Now you will need to enter both L1 and L2(separated by a comma) as arguments of the mean( function. The mean( function can take two arguments - both the data values and their frequencies. The frequencies argument is optional and the calculator assumes a frequency of 1 for each data value if no other frequencies are given. • After entering L1 and L2 as arguments of the mean( function press enter. The calculator will return the mean of the data.
Finding the Median • To find the median of a data set using the calculator put the data values in L1. They do not need to be sorted first. • After going back to the home screen bring up the LIST screen and move the cursor to highlight MATH. • Option 4 on the MATH screen is median(. Choosing option 4 will return median( to the screen. • Lastly, tell the calculator to find the median of the data in L1 by entering L1 after median( . Close the parentheses and press enter. The calculator will return the median of the entries in L1.
Finding the Median of a Frequency Distribution • Often you have data expressed as a frequency distribution. If the data values are in L1 and the corresponding frequency values are in L2 finding the median of the data involves more than finding the median of the values in L1. If you find the median of just the values in L1 you are not taking into account their frequencies. • In this case, select median( from the LIST / MATH screen as before. Now you will need to enter both L1 and L2(separated by a comma) as arguments of the median( function. The median( function can take two arguments - both the data values and their frequencies. The frequencies argument is optional and the calculator assumes a frequency of 1 for each data value if no other frequencies are given. • After entering L1 and L2 as arguments of the median( function press enter. The calculator will return the median of the data.
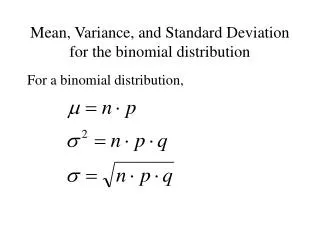
Finding the Standard Deviation • To find the standard deviation of a data set using the calculator put the data values in L1. They do not need to be sorted first. • After going back to the home screen bring up the LIST screen and move the cursor to highlight MATH. • Option 7 on the MATH screen is stdDev(. Choosing option 7 will return stdDev( to the screen. • Lastly, tell the calculator to find the standard deviation of the data in L1 by entering L1 after stdDev(. Close the parentheses and press enter. The calculator will return the standard deviation of the entries in L1.
Finding the Standard Deviation of a Frequency Distribution • Often you have data expressed as a frequency distribution. If the data values are in L1 and the corresponding frequency values are in L2 finding the standard deviation of the data involves more than finding the standard deviation of the values in L1. If you find the standard deviation of just the values in L1 you are not taking into account their frequencies. • In this case, select stdDev( from the LIST / MATH screen as before. Now you will need to enter both L1 and L2(separated by a comma) as arguments of the stdDev( function. The stdDev( function can take two arguments - both the data values and their frequencies. The frequencies argument is optional and the calculator assumes a frequency of 1 for each data value if no other frequencies are given. • After entering L1 and L2 as arguments of the stdDev( function press enter. The calculator will return the standard deviation of the data.