Download
1 / 19
190 likes | 276 Views
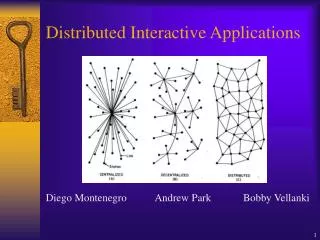
Explore the utilization of Grid technology for analyzing brain activity data collected through Magnetoencephalography (MEG). Learn about the NeuroGrid project, its architecture, evaluation using Independent Component Analysis (ICA), and conclusions drawn. Discover how the integration of Grid systems can revolutionize brain science research.

E N D
Distributed Brain Activity Analysis Applications • Arhitectura Sistemelor Cluster si GRID– 12 January 2011 R. Buyya, S. Date, Y. Mizuno-Matsumoto, S. Venugopal and D. Abramson Y. Mizuno-Matsumoto, S. Date, T. Kaishima, Y. Kadobayashi and S. Shimojo Laura Gheorghe laura.gheorghe@cs.pub.ro
Contents • Brain activity analysis application • The Grid • NeuroGrid project • NeuroGrid architecture • Evaluation using ICA • ICA architecture • ICA implementation • Conclusions Arhitectura Sistemelor Cluster si GRID 12.01.2011
The problem Brain science: Includes critical research Analyzing brain activity data Gathered with the MEG Identify diagnostic Needs large-scale computing resources The most appropriate solution: run application on Grid Arhitectura Sistemelor Cluster si GRID 12.01.2011 3
The Grid Emerging technology Used for sharing, selecting and aggregating distributed resources Computational Grids: Aggregations of distributed computing resources Solve a great range of science and engineering problems Arhitectura Sistemelor Cluster si GRID 12.01.2011 4
Brain activity analysis Magnetoencephalography (MEG) Used to measure brain activity Determining the magnetic fields generated by the electrical activity of the brain More precise and non-invasive (compared with the EEG) Helmet with more than 200 sensors to detect magnetic fields 64 sensors => 1GB data in 1 hour Analyzing data requires large amounts of computing resources Arhitectura Sistemelor Cluster si GRID 12.01.2011 5
Brain activity analysis using Grid technology R. Buyya et. al. Developed an infrastructure for analyzing MEG data Uses Grid technologies: Nimrod-G Gridbus Globus Y. Mizuno-Matsumoto et. al. Developed a medical infrastructure Uses ICA algorithm for data processing Runs in a Grid environment Uses MPICH-G modules added in a plug-in manner Arhitectura Sistemelor Cluster si GRID 12.01.2011 6
NeuroGrid Project Developed by R. Buyya et. al. Convert the brain activity analysis application Into a parameter sweep application Resulting jobs that can be run in parallel A job Wavelet cross-correlation analysis for each pair of sensors Computationally and data intensive Arhitectura Sistemelor Cluster si GRID 12.01.2011 7
NeuroGrid steps Doctors perform a MEG scan of the patient’s brain The MEG generates a large set of data The data is sent to the Resource Broker of the Grid The RB uses the Grid Market Directory to locate resources The code and data are sent to the remote nodes The results are collected Arhitectura Sistemelor Cluster si GRID 12.01.2011 8
NeuroGrid architecture Components: the brain activity analysis application parameterization tools – Nimrod-G parameter specification language compose the application as a parameter sweep application the resource broker – Nimrod-G with Gridbus scheduler Discovers and allocates resources for jobs Grid Market Directory – Gridbus GMD maintains information about resource providers and services low-level Grid middleware – Globus Arhitectura Sistemelor Cluster si GRID 12.01.2011 9
NeuroGrid architecture Arhitectura Sistemelor Cluster si GRID 12.01.2011 10
Gridbus and GMD Gridbus scheduler as a plugin scheduler with Nimrod-G able to communicate with the Grid Market Directory (GMD) GMD allows GSPs (Grid Service Providers) to publish application services specify a certain AO (Application Operation) service price AO service price - the execution cost of an application on a resource The scheduler uses two parameters specified by the user: the deadline until which the application results are required the budget Gridbus scheduler implements three algorithms: cost minimization time minimization cost-time minimization
NeuroGrid application 2 components: raw2wavelet a program that performs wavelet transform on the raw MEG data wavelet2cross a program that performs the cross-correlation analysis between the wavelet transforms A job executing this pair of programs in sequence for a specific pair of sensors and for a certain offset For data from 64 sensors -> almost 60.000.000 jobs 1 job – less than a minute
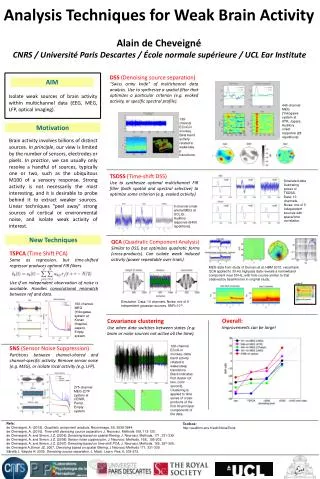
Evaluation of brain function using ICA Developed by Y. Mizuno-Matsumoto et. al. Grid-based MEG analysis system Using Globus Grid Toolkit 1.1.4. MPICH-G2 for software development Independent Component Analysis (ICA) Analysis method used to evaluate MEG data Instead of wavelet cross-correlation analysis Arhitectura Sistemelor Cluster si GRID 12.01.2011 13
Evaluation using ICA - Overview Steps: collecting large amounts of data using the MEG instrument processing and analyzing data in a computational center determining a diagnosis in a specialized medical institute ICA: method to identify and analyze brain signals uses a blind separation technique based on information-maximization separate identifiable components into individual output channels Requires large amounts of processing power Arhitectura Sistemelor Cluster si GRID 12.01.2011 14
Evaluation using ICA - Architecture 3 modules: Communication module Computation module Visualization module Arhitectura Sistemelor Cluster si GRID 12.01.2011 15
Evaluation using ICA - Architecture modular approach => scalability and flexibility easy adding and removing signal processing techniques The visualization module: displaying the analysis results in an intuitive manner permits the user to perform various operations configure the interface to invoke any analysis method The computation module: implements the signal processing method (ICA method) able to use the computation power provided by the Grid environment Arhitectura Sistemelor Cluster si GRID 12.01.2011 16
Evaluation using ICA - Architecture The communication module: enables the communication between the computation and the visualization modules sending computation requests to the computation module receiving the results and delivering them to the visualization module able to establish point-to-multipoint communication over the Grid environment => multiple users to simultaneously perform brain data analysis Arhitectura Sistemelor Cluster si GRID 12.01.2011 17
Evaluating using ICA - Implementation Uses MPICH-G because: provides easy development of applications on the Grid has a smaller cost and time for development than the Globus API Defined a communication template can be used to easily access computation modules without being aware of the Grid environment must define the communication pattern for batch-processing plug-in manner ICA algorithm complexity of O(n4) distributed the workload on several CPUs using the block mapping method Arhitectura Sistemelor Cluster si GRID 12.01.2011 18
Conclusions The advantage of the Grid technology: able to provide infinite computational resources geographically distributed able to use high-performance computers The best solution to perform medical data analysis Arhitectura Sistemelor Cluster si GRID 12.01.2011 19