Download
1 / 32
340 likes | 525 Views
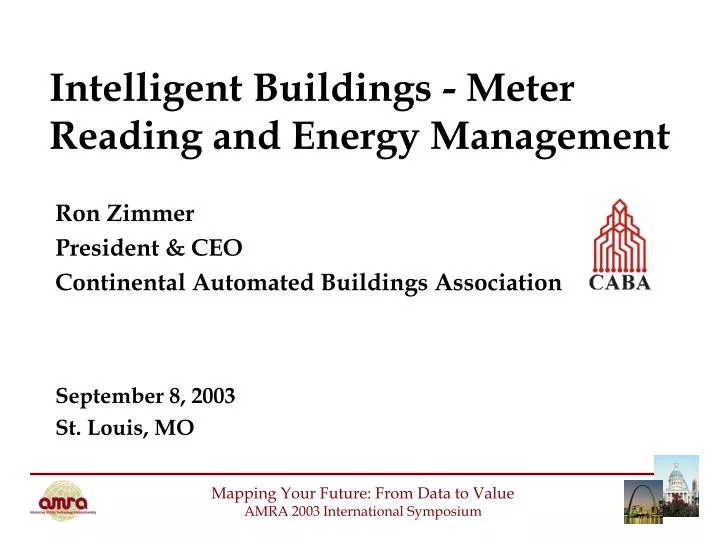
Intelligent Buildings - Meter Reading and Energy Management. Ron Zimmer President & CEO Continental Automated Buildings Association September 8, 2003 St. Louis, MO. Mapping Your Future: From Data to Value AMRA 2003 International Symposium. Presentation Objectives.

E N D
Intelligent Buildings - Meter Reading and Energy Management Ron Zimmer President & CEO Continental Automated Buildings Association September 8, 2003 St. Louis, MO Mapping Your Future: From Data to Value AMRA 2003 International Symposium
Presentation Objectives 1. Energy Management 2. Meter Reading 3. Intelligent/High Performance Buildings 4. Benefits and Opportunities Mapping Your Future: From Data to Value AMRA 2003 International Symposium
Continental Automated Buildings Association Mission Statement: “ To encourage the development, promotion, pursuit and understanding of integrated systems and automation in homes and buildings.” www.caba.org Mapping Your Future: From Data to Value AMRA 2003 International Symposium
Definition of Intelligent Building Technologies “ The use of integrated technological building systems, communications and controls to create a building and its infrastructure which provides the owner, operator and occupant with an environment which is flexible, effective, comfortable and secure.” Source: Technology Roadmap for Intelligent Buildings (http://www.caba.org/trm) Mapping Your Future: From Data to Value AMRA 2003 International Symposium
Once Upon a Time... SOURCE: Equity Office Mapping Your Future: From Data to Value AMRA 2003 International Symposium
Large Centralized production, transportation and distribution of power by government regulated monopolies. 1940 - 1970 Deregulation of natural gas market; Incentives for efficient on site generation of electric power. 1980 Deregulation of electric power (almost)! Market-driven system, promoting efficient generation, supply, production, distribution and utilization of all power commodities. 1990 2000 & Beyond Energy Through the Century and Beyond 1900 - 1930s Energy Generated on Site Steam - Electric - Mechanical. Mapping Your Future: From Data to Value AMRA 2003 International Symposium
$75B Total $400B Total $25B Total Overall Energy Market Supply Production Distribution $250B - Electric $ 90B - Natural Gas $ 60B - Other Fuels $ 45B - Facilities $ 30B - O & M $ 25B - Electric - Steam - Air - Chilling - etc. $500,000,000,000 Annual Market Mapping Your Future: From Data to Value AMRA 2003 International Symposium
U.S. Energy Consumption By Category SOURCE: Equity Office Mapping Your Future: From Data to Value AMRA 2003 International Symposium
The Commercial Building Sector Will Continue to Grow Its Share of US Energy Consumption Mapping Your Future: From Data to Value AMRA 2003 International Symposium
1970’s-2000 After 2000 Pricing TOU Rates Real Time Pricing Metering Time Period Loads Hourly (Sub-hourly) Loads Load Shape Objectives Peak , Shaving Shifting, Conservation Preserve Reliability Cost Management Customer Involvement Utility Command/Control Interactive Market Demand Respond Curtailable, Interruptible Direct Control Demand Bidding, Risk Management, Intelligent Controls Paradigm Shift Evolution Trends: • Reduced choice • Increasing costs • Lack of control • Declining value to customers • Increasing choice • Cost volatility • Value of information • From Figure 1-1New Principles for Demand Response PlanningEPRI Final Report, May 2002
EOP Is Exposed to Varied & Changing Energy Regulatory Environments and Market Prices Status of electricity market restructuring & 2002 prices (c/kWh): IN (6.0) WA (6.3) NY (12.2) OH (7.7) MN (6.0) OR (6.9) MA (10.1) CT (9.3) PA (8.3) IL (8.3) UT (5.5) DC (7.5) CO (5.6) CA (13.2) VA (5.9) NC (6.5) Legend: AZ (6.1) Deregulation legislation not passed GA (6.5) TX (6.8) Legislation passed; no action taken FL (6.7) Partial competition: IOUs restructuring / deregulation suspended LA (6.7) Full competition SOURCE: Equity Office Note: Prices in c/kWh for Jan to Sept. 2002 for Commercial sector Source: Energy Information Administration; Energyguide.com
NEW PARADIGM - Supply Management In the New Paradigm you’ll have to be just as knowledgeable on energy supply products as energy conservation methods due to value-cost tradeoffs. New products connect the value of the hedged volumes with the cost of demand response alternatives. Corporate guidelines for commodity risk management /accounting to support real time, value-cost decision making. SOURCE: Sempra Energy Solutions
Demand Response The FERC On Demand Response… “Market rules…must not unduly bias the choice between demand or supply resources, nor provide competitive advantages or disadvantages to large or small demand or supply resources. Demand resources…should be able to participate fully in energy, ancillary services and capacity markets.” “Demand can best respond by participating in the day-ahead market. Demand response options should be available so that end users can respond to price signals and reduce loads as they feel the price exceeds their individual willingness to pay for delivered electricity.” SOURCE: Sempra Energy Solutions FERC, Electricity Market Design and Structure Working Paper, 3/02
Demand Response Real time telemetry/metering system to include sub-metering of system segments. Segmenting critical, non-critical loads, high priority & low priority loads. Deploy/effectively control all on-site distributedresources. Incorporate software that can respond to real time price signals by automatically controlling load segments. Incorporate all the EnergyStar® Buildings design and construction materials to ensure lowest absolute energy needs. SOURCE: Sempra Energy Solutions
NEW PARADIGM - Examples • Retail customers will be linked to wholesale (ISO/RTO) markets in real time. • Demand reduction as an option: • Pay for the right to ask you to shut down some of the load. • On-site generation as an option: • Via load reduction. • Dispatch to the grid. • Pay you for the right to turn on your generator. • Need to view long-term retail supply and ability to dynamically manage it as an asset. SOURCE: Sempra Energy Solutions
Energy & Expense Profiles Perform Rate Analysis DispatchDistributedGenerators Utility Bill Analysis & Validation ENTERPRISE – EMS Performance Metrics Weather/Occupancy Compensation Energy Alarms Energy Monitoring and IT SOURCE: Equity Office Mapping Your Future: From Data to Value AMRA 2003 International Symposium
SOURCE: Gridlogix, Inc. Mapping Your Future: From Data to Value AMRA 2003 International Symposium
Energy Monitoring & IT Distributed processing provides low-cost access to real time revenue-grade data. Digital revenue-grade meters can store months of information. Web-based systems provide communications to thousands of meters. Systems are capable of integrated energy and financial algorithms. SOURCE: Equity Office Mapping Your Future: From Data to Value AMRA 2003 International Symposium
BUILDING & ENERGY MGT. SYSTEMS 1. Energy Information Systems (EIS) 2. Building Management Systems (BMS) 3. Energy Management and Control Systems (EMCS) 4. Enterprise Energy Management (EEM) 5. Demand Response Systems (DRS) 6. Advanced Demand Response Systems (ADRS) 7. Intelligent Energy Management Systems (IEMS) Source: WebGen Systems Mapping Your Future: From Data to Value AMRA 2003 International Symposium
SOURCE: WebGen Systems Mapping Your Future: From Data to Value AMRA 2003 International Symposium
SOURCE: WebGen Systems Mapping Your Future: From Data to Value AMRA 2003 International Symposium
RECOMMENDATIONS: 1. Use an open standard, such as BACnet or LonWorks; 2. Manage systems integration between these buildings in- house; and 3. Use an Intelligent Energy Management System. Note: Further information can be found on CABA’s Information Series “Why Intelligent Agents can reduce Energy Costs better than Building Mgt. Systems or Human Experts”. Source: WebGen Systems Mapping Your Future: From Data to Value AMRA 2003 International Symposium
Electricity Usage SOURCE: Alan Whitson Mapping Your Future: From Data to Value AMRA 2003 International Symposium
Who Gets the Energy Savings... • Total Savings $0.50/Sq. Ft. • Tenant Saves $0.15/Sq. Ft. • Landlord Saves $0.35/Sq. Ft. • Building Value Increases • $0.35 Net Energy Savings • ÷ 7.5% Cap Rate • $4.67 Increased Value • Bottom Line - $1,657,850 355,000 SF 19-Story Building SOURCE: Alan Whitson Mapping Your Future: From Data to Value AMRA 2003 International Symposium
Saving Energy Pays • Invest $1.25/sq. ft. in an Efficient Lighting Upgrade • Saves $0.50/sq. ft. in Energy Costs per Year • Payback - 2.5 Years • ROI - 40% • Creates $6.67/sq. ft. in Building Value • ROI - 533.6% SOURCE: Alan Whitson Mapping Your Future: From Data to Value AMRA 2003 International Symposium
TIFFANY BUILDING - SAN FRANCISCOModeled Savings Annual Utility Savings Payback (Yrs.)* Measure Cost $250,000 $58,956 4.2 Building Controls Convert SF 1&2 to VAV $260,000 $45,093 5.5 VFD Cooling Tower $11,000 $2,603 3.5 $521,000 $106,652 SOURCE: Kenmark Controls, Inc. * Calculations include California energy incentives Mapping Your Future: From Data to Value AMRA 2003 International Symposium
Echelon Building 1 San Jose: 75,000 sq ft 2000 points monitored 2001 Energy Costs: Electricity: $ 296,533 Gas: $35,946 KWh: 1,740,000(Model): 4,134,000 KWhSavings: -58% SOURCE: Kenmark Controls, Inc. Mapping Your Future: From Data to Value AMRA 2003 International Symposium
IS METER READING/ENERGY MANAGEMENT IMPORTANT? NEWS BULLETIN June 23, 2003 - Public Service Electric and Gas (PSE&G), New Jersey’s largest regulated utility, serving nearly 3/4 of the states population, announced spending of $1.4 billion over the next five years to improve its electric systems... Mapping Your Future: From Data to Value AMRA 2003 International Symposium
National Energy Marketers Association (NEMA) Recommendations: 1. Upgrade Nation’s Aging Energy Infrastructure. 2. Implement Advanced Metering. 3. Grant Consumers Access to Usage Data. 4. Take Measures to Make Metering Open/Competitive. 5. Encourage Competitive Metering Through Investments Vehicles to Upgrade Metering Systems. 6. Combined Advanced Metering Technology with the Internet. SOURCE: NEMA Mapping Your Future: From Data to Value AMRA 2003 International Symposium
FUTURE RESEARCH U.K. CARBON TRUST - LOW CARBON INNOVATION PROGRAMME AIM - To obtain independent data on use of advanced metering techniques applied to utility metering for Metering, Monitoring and Targeting at SME level. www.thecarbontrust.co.uk Mapping Your Future: From Data to Value AMRA 2003 International Symposium
FUTURE EVENT Produced and Managed by: CABA and EH EVENTS & EDUCATION www.accessthehome.com Mapping Your Future: From Data to Value AMRA 2003 International Symposium
Your Information Source for Home and Building Automation www.caba.org E: caba@caba.orgT: 613.990.7407F: 613.991.9990US/ Canada: 888.798.2222Mexico: 001.888.514.2222 Mapping Your Future: From Data to Value AMRA 2003 International Symposium