Download
1 / 54
540 likes | 680 Views
The linear algebra of atmospheric convection. Brian Mapes Rosenstiel School of Marine and Atmospheric Sciences, U. of Miami with Zhiming Kuang, Harvard University. Physical importance of convection. v ertical flux of heat and moisture i.e., fluxes of sensible and latent heat

E N D
The linear algebra of atmospheric convection Brian Mapes Rosenstiel School of Marine and Atmospheric Sciences, U. of Miami with Zhiming Kuang, Harvard University
Physical importance of convection • vertical flux of heat and moisture • i.e., fluxes of sensible and latent heat • (momentum ignored here) • Really we care about flux convergences • or heating and moistening rates • Q1 and Q2 are common symbols for these • (with different sign and units conventions)
Kinds of atm. convection • Dry • Subcloud turbulent flux • may include or imply surface molecular flux too • Moist (i.e. saturated, cloudy) • shallow (cumulus) • nonprecipitating: a single conserved scalar suffices • middle (congestus) & deep (cumulonimbus) • precipitating: water separates from associated latent heat • Organized • ‘coherent structures’ even in dry turbulence • ‘multicellular’ cloud systems, and mesoscale motions
“Deep” convection • Inclusive term for all of the above • Fsurf, dry turbulence, cu, cg, cb • multicellular/mesoscale motions in general case • Participates in larger-scale dynamics • Statistical envelopes of convection = weather • one line of evidence for near-linearity • Global models need parameterizations • need to reproduce function, without explicitly keeping track of all that form or structure
deep convection: cu, cg, cb, organized http://www.rsmas.miami.edu/users/pzuidema/CAROb/ http://metofis.rsmas.miami.edu/~bmapes/CAROb_movies_archive/?C=N;O=D
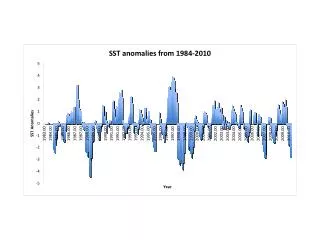
interacts statistically with large scale waves straight line = nondispersive wave 1998 CLAUS Brightness Temperature 5ºS-5º N
A convecting “column” (in ~100km sense) is like a doubly-periodic LES or CRM • Contains many clouds • an ensemble • Horizontal eddy flux can be neglected • vertical is
Atm. column heat and moisture budgets, as a T & q column vector equation: water phase changes eddy flux convergence LS dynamics rad. Surface fluxes and all convection (dry and moist). What a cloud resolving model does.
Outline • Linearity (!) of deep convection (anomalies) • The system in matrix form • M mapped in spatial basis, using CRM & inversion (ZK) • math checks, eigenvector/eigenvalue basis, etc. • Can we evaluate/improve M estimate from obs?
Linearity (!) of convection My first grant! (NSF) Work done in mid- 1990s Hypothesis: low-level (Inhibition) control, not deep (CAPE) control (Salvage writeup before moving to Miami. Not one of my better papers...)
Low-level Temperature and Moisture Perturbations Imposed Separately Inject stimuli suddenly Q1 anomalies Q1 Courtesy Stefan Tulich (2006 AGU)
Linearity test of responses: Q1(T,q) = Q1(T,0) + Q1(0,q) ? both sum sum, assuming linearity q T q T both Yes: solid black curve resembles dotted curve in both timing & profile Courtesy Stefan Tulich (2006 AGU)
Linear expectation value, even when not purely deterministic Ensemble Spread Courtesy Stefan Tulich (2006 AGU)
Outline • Linearity (!) of deep convection (anomalies) • The system in matrix form • in a spatial basis, using CRM & inversion (ZK) • could be done with SCM the same way... • math checks, eigenvector/eigenvalue basis, etc. • Can we estimate M from obs? • (and model-M from GCM output in similar ways)?
Multidimensional linear systems can include nonlocal relationships Can have nonintuitive aspects (surprises)
Splice together T and q into a column vector (with mixed units: K, g/kg) • Linearized about a steadily convecting base state • 2 tried in Kuang 2010 • 1. RCE and 2. convection due to deep ascent-like forcings
Zhiming’s inverse casting of problem measure time-mean, domain mean sounding anoms. • ^^ With these, build M-1 column by column • Invert to get M! (computer knows how) • Test: reconstruct transient stimulus problem Make bumps on CRM’s time-mean convective heating/drying profiles
Specify LSD + Radiation as steady forcing. Run CRM to ‘statistically steady state’ (i.e., consider the time average) 0 Treat all this as a time-independent large-scale FORCING applied to doubly-periodic CRM (or SCM) All convection (dry and moist), including surface flux. Total of all tendencies the model produces. 0 for a long time average
Forced steady state in CRM T Forcing (cooling) CRM response (heating) Surface fluxes and all convection (dry and moist). Total of all tendencies the CRM/ SCM produces. q Forcing (moistening) CRM response (drying)
Now put a bump (perturbation) on the forcing profile, and study the time-mean response of the CRM CRM time-mean response: heating’ balances forcing’ (somehow...) T Forcing (cooling) Surface fluxes and all convection (dry and moist). Total of all tendencies the CRM/ SCM produces.
How does convection make a heating bump? = anomalous convective heating 1. cond 1. Extra net Ccondensation, in anomalous cloudy upward mass flux 2. EDDY: Updrafts/ downdrafts are extra warm/cool, relative to environment, and/or extra strong, above and/or below the bump How does convection ‘know’ it needs to do this?
How does convxn ‘know’? Env. tells it!by shaping buoyancy profile; and by redefining ‘eddy’ (Tp – Te) (another linearity test: 2 lines are from heating bump & cooling bump w/ sign flipped) via vertically local sounding differences.. cond ... and nonlocal (net surface flux required, so surface T &/or q must decrease) 0 0 0 0 Kuang 2010 JAS
Image of M-1 0 0 Tdot T’ qdot T’ z Tdot q’ qdot q’ z -4 Units: K and g/kg for T and q, K/d and g/kg/d for heating and moistening rates Unpublished matrices in model stretched z coordinate, courtesy of Zhiming Kuang
M-1 and M from 3D 4km CRM from 2D 4km CRM ( ^^^ these numbers are the sign coded square root of |Mij| for clarity of small off-diag elements)
M-1 and M from 3D 4km CRM from 3D 2km CRM ( ^^^ these numbers are the sign coded square root of |Mij| for clarity of small off-diag elements)
Finite-time heating and moistening has solution: So the 6h time rate of change is:
M [exp(6h×M)-I] /6h Spooky action at a distance: How can 10km Q1 be a “response” to 2km T? (A: system at equilibrium, calculus limit) Fast-decaying eigenmodes are noisy (hard to observe accurately in equilibrium runs), but they produce many of the large values in M. Comforting to have timescale explicit? Fast-decaying eigenmodes affect this less.
Low-level Temperature and Moisture Perturbations Imposed Separately Inject stimuli suddenly Q1 anomalies Q1 Courtesy Stefan Tulich (2006 AGU)
Columns: convective heating/moistening profile responses to T or q perturbations at a given altitude z (km) z (km) z (km) z (km) 0 1 2 5 8 12 0 1 2 5 8 12 0 1 2 5 8 12 0 1 2 5 8 12 0 square root color scale
Image of M Units: K and g/kg for T and q, K/d and g/kg/d for Tdot and qdot z (km) z (km) z (km) z (km) 0 1 2 5 8 12 0 1 2 5 8 12 0 1 2 5 8 12 0 1 2 5 8 12 q’ Tdot T’ Tdot 0 PBL FT PBL FT FT PBL q’ qdot T’ qdot square root color scale
Image of M (stretched z coords, 0-12km) Units: K and g/kg for T and q, K/d and g/kg/d for Tdot and qdot + - + positive T’ within PBL yields... z T’ Tdot q’ Tdot 0 +/-/+ : cooling at that level and warming of adjacent levels (diffusion) z q’ qdot T’ qdot square root color scale
Off-diagonal structure is nonlocal(penetrative convection) 0 square root color scale
Off-diagonal structure is nonlocal(penetrative convection) z (km) z (km) z (km) z (km) 0 1 2 5 8 12 0 1 2 5 8 12 0 1 2 5 8 12 0 1 2 5 8 12 T’ Tdot q’ Tdot 0 + effect of q’ on heating above its level T’ cap inhibits deepcon T’+ (cap) qdot+ below q’ qdot T’ qdot square root color scale
Integrate columns in top half x dp/g 0 square root color scale
Integrate columns in top half x dp/gof [exp(6h×M)-I] /6h 0 compare plain old M
A check on the method prediction for the Tulich & Mapes ‘transient sensitivity’ problem domain mean profile evolution (since Q1 and Q2 are trapped within the periodic CRM) initial ‘stimuli’ in the domain-mean T,q profiles
Example: evolution of initial warm blip placed at 500mb in convecting CRM Doing the actual experiment in the CRM: Computed as [exp( (M-1)-1 t)] [Tinit(p),0]: Appendix of Kuang 2010 JAS
Example: evolution of initial moist blip placed at 700mb in convecting CRM Doing the actual experiment in the CRM: Computed via exp( (M-1)-1 t): Appendix of Kuang 2010 JAS
Example: evolution of initial moist blip placed at 1000mb in convecting CRM Doing the actual experiment in the CRM: Computed via exp( (M-1)-1 t): Appendix of Kuang 2010 JAS
Outline • Linearity (!) of deep convection (anomalies) • The system in matrix form • mapped in a spatial basis, using CRM & inversion (ZK) • math checks, eigenvector/eigenvalue basis • Can we estimate M from obs? • (and model-M from GCM output in similar ways)?
EigenvaluesSort according to inverse of real part(decay timescale) 3D CRM results 2D CRM results 10 Days 1 Day 2.4 h 15 min There is one mode with slow (2 weeks!) decay, a few complex conj. pairs for o(1d) decaying oscillations, and the rest (e.g. diffusion damping of PBL T’, q’ wiggles)
Slowest eigenvector: 14d decay time 3D CRM results 2D CRM results 0 Column MSE anomalies damped only by surface flux anomalies, with fixed wind speed in flux formula. A CRM setup artifact.* *(But T/q relative values & shapes have info about moist convection?)
eigenvector pair #2 & #3~1d decay time, ~2d osc. period 3D CRM results 2D CRM results congestus-deep convection oscillations
Singular Value Decomposition • Formally, the singular value decomposition of an m×n real or complex matrix M is a factorization of the form M = UΣV* where U is an m×m real or complex unitary matrix, Σ is an m×ndiagonal matrix with nonnegative real numbers on the diagonal, and V* (the conjugate transpose of V) is an n×n real or complex unitary matrix. The diagonal entries Σi,i of Σ are known as the singular values of M. The m columns of U and the n columns of V are called the left singular vectors and right singular vectors of M, respectively.