Download
1 / 37
370 likes | 501 Views
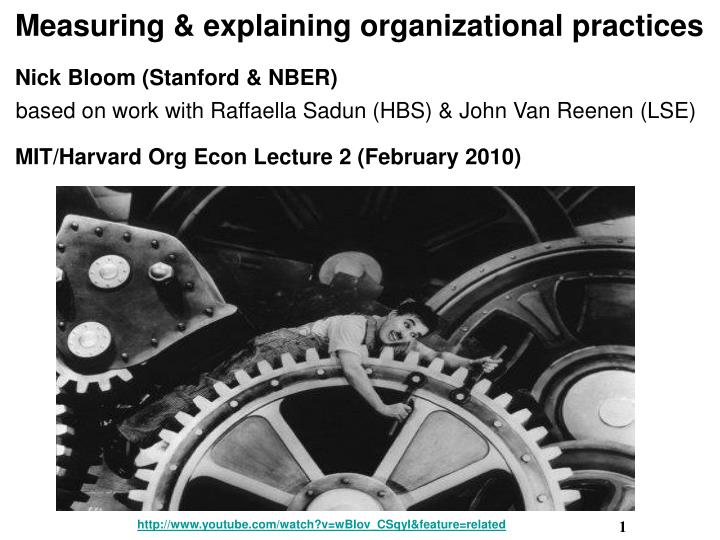
Measuring & explaining organizational practices Nick Bloom (Stanford & NBER) based on work with Raffaella Sadun (HBS) & John Van Reenen (LSE) MIT/Harvard Org Econ Lecture 2 (February 2010). http://www.youtube.com/watch?v=wBIov_CSqyI&feature=related.

E N D
Measuring & explaining organizational practices Nick Bloom (Stanford & NBER)based on work with Raffaella Sadun (HBS) & John Van Reenen (LSE) MIT/Harvard Org Econ Lecture 2 (February 2010) http://www.youtube.com/watch?v=wBIov_CSqyI&feature=related
Theory ahead of measurement in organizational economics • Impressive theoretical literature on the organization of the firm • Traditionally much less empirical work because of difficulties in defining “organization” and collecting data • Today I will overview some current organizational data 2
Lecture 2: Overview • Measuring organization: spans and decentralization • Differences in organization across firms, countries & time • Factors driving the organization of firms • Organization and productivity • Conclusions
The simple model – organization within a 2-level firm Manager Span of control:the number of workers reporting to the manager Worker autonomy:low if managers take most decisions; high if workers take most decisions Workers
A more realistic multi-plant multi-level firm example Plant manager autonomy:low if CEO takes most non-production decisions; high if plant manager takes most decisions CEO CEO span: number of plants Plant Manager 1 Plant Manager 2 Plant Manager 3 Plant manager span:people reporting to PM Worker autonomy:low if plant managers take most production decisions; high if workers take most decisions Workers Workers Workers Scranton Tokyo London
Bloom, Sadun and Van Reenen (2009) collect span and decentralization data on about 600 firms • Quantifying: measure decentralization of hiring, investment, sales and production decisions from CHQ to plant manager • Also collect spans and worker decentralization (detailed in Bloom, Garicano, Sadun and Van Reenen, 2009) • 2) Truth: use double blind as in Bloom and Van Reenen (2007) • 3) Data: use various tricks as in Bloom and Van Reenen (2007) • Introduced as “Lean-manufacturing” interview, no financials • Official Endorsement: Bundesbank, Treasury, RBI , etc. • Run by 45 MBA types (loud, assertive & business experience) • 4) Sample: Manufacturing firms with 100 to 5000 employees
Lecture 2: Overview • Measuring organization: spans and decentralization • Differences in organization across firms, countries & time • Factors driving the organization of firms • Organization and productivity • Conclusions
The Bloom, Sadun and Van Reenen (2009) empirical decentralization measure • Main measure averages the z-score (scores normalized to mean 0, standard-deviation 1) of each variable: • Hiring senior employees (discrete, 1 to 5) • Maximum Capital expenditure (continuous, in $) • Introduction of new products (discrete, 1 to 5) • Sales and marketing (discrete, 1 to 5)
Decentralization varies across countries • Most centralized • Asia • Southern Europe • Least centralized • Scandinavian countries • Anglo-Saxon countries Decentralization measure
Decentralization also varies across firms Decentralization measure (higher number is more decentralized)
External validation – country level (1/2) • Do these cross-country values look sensible? • Only prior firm decentralization measure to cross-check against we are aware of is from Hofstede (1980) • Surveyed c.100,000 IBM employees across 50 countries during the 1970s & early 1980s • Questions on management style (autocractic/paternalistic or consultative) and preferences for delegation • Combined into Power Distance index (1-100), low means limited (preference for) delegation
‘Power distance’ seems correlated with our firm decentralization Decentralization Correlation= 0.80 Power distance
External validation – country level (2/2) • There is also a cross-country index of Fiscal Decentralization from Arzaghi and Henderson (2005, JPubE) • Index of Fiscal Decentralization based on 9 factors including: • Government structure (e.g. unitary v federal) • Local (regional/municipal) democratization & autonomy • Local (regional/municipal)control over taxation and spending (education, police, transport etc.) • Surveyed every country with >10 million people (in 1995)
‘Fiscal decentralization’ is also correlated with firm decentralization Firm Decentralization Correlation= 0.83 Fiscal Decentralization
Internal validation – the re-rater survey Correlation between 1st and 2nd interviews (72 firms) correlation 0.51(p-value <0.001) Decentralization – 2nd interview Decentralization – 1st interview
We also collected data on spans & worker autonomy • Turn out spans of control is only weakly correlated with decentralization (about 0.10) • I think reason is formal authority not the same as real authority • http://www.youtube.com/watch?v=5FRVvjGL2C0 but measurement error with span undoubtedly also a problem • Worker decentralization is quite strongly correlated with plant manager span (about 0.20) • Suggests factors that drive decentralization in upper and lower parts of the firms are probably correlated 17
What about changes in decentralization over time? "Globalization and the arrival of the information economy have rapidly demolished all the old precepts. The management of global companies, which must innovate simultaneously and speed information through horizontal globe-spanning networks, has become a daunting challenge. Old, rigid hierarchies are out ...." Business Week The 21st Century Corporation, cover story August 21-28, 2000. 18
Increasing Delayering – positions reporting to CEO Source: Rajan and Wulf, 2006, 300+ large US corporations 19
Lecture 2: Overview • Measuring organization: spans and decentralization • Differences in organization across firms, countries & time • Factors driving the organization of firms • Organization and productivity • Conclusions
General modeling framework • Principal-agent • Principal is the Corporate Head Quarters (CHQ) • Agent is the plant manager • Optimal decentralization depends on trade-off between: • Managers typically have better local information than CHQ • Manager’s incentives diverge from firm’s (agency problem) • This can of course be extended in many ways – for example: • Need for coordination (Alonso et al. 2008) • Incentives to communicate • Multi-level agency problems with CEO and owners
Trust and decentralization • Trust may affect optimal decentralization • Facilitate cooperative solutions in repeated game settings: e.g. Baker, Gibbons and Murphy (1999) • Proxy the congruence of incentives: e.g. Aghion and Tirole (1997) • More broadly, reliability of manager and/or information: Rajan & Zingales (2002), Hart & Moore (2005) • We find evidence of robust positive relationship between trust in region where plant is located and decentralization
Measuring trust • Measure trust using the World Value Survey, from the question: “Generally speaking, would you say that most people can be trusted or that you can’t be too careful in dealing with people?” • Trust by region of the country defined as % of people answering “yes” to first part of the trust question • Experimental studies show this question linked with trust/trusting behavior (Glaeser et al, 2000, Sapienza et al, 2007) • Used in prior social capital literature: e.g. Knack & Keefer (1997); Guiso, Sapienza, Zingales (2004);
Trust and decentralization Notes: Other controls are SIC3 dummies, noise Controls (interviewer dummies, Interviewee tenure and seniority, etc.), public Listing, CEO onsite, plant size, regional GDP/head, Regional population, domestic multinational. Weighted by % of WVS respondents in region in country. SE clustered by 112 regions.
Use multinationals as a second test for trust • Could worry about bias due to trust proxying for other country/regional variables • So look at affiliates of foreign multinationals and investigate whether trust in their home country also matters
Central HQ (New York Site) Plant (Phoenix Site) Example A: Domestic Firm 2 Sites, Single Plant D, Decentralization
Example D Japanese MNE Global HQ (Tokyo Site) Do not observe D French CHQ (Paris Site) Sweden CHQ (Stockholm Site) Observe D Observe D Plant 1 (Lund Site) Plant 2 (Lyon Site)
Competition and decentralization – basic theory • Prior work had found a strong positive link – Guadalupe and Wulf (2008) look at Canadian free trade experiment • But theory is actually ambiguous • Competition may affect information: • Improves the value of timely responses to local conditions (e.g. Aghion & Tirole, 1997) • But, reduces value of local information as more firms for the principal to learn from (e.g. Acemoglu et al. 2007) • Competition may also affect incentives: • Lower risk of managerabusing autonomy as incentives more aligned with firm (e.g. Schmidt 1997, Vives 2005) • Less incentive to co-ordinate prices (Alonso et al. 2008)
Decentralization higher with more competition Notes: Other controls are SIC3 dummies, 12 country dummies, noise controls (interviewer dummies Interviewee tenure and seniority, etc.), public listing, CEO onsite, plant size, Number of competitors (0=none, 1=between 1 and 4, 2=5 or more (as reported by plant manager).
Industry volatility and age • Acemoglu, Aghion, Le Large Van Reenen and Zillabotti (2007, QJE) develop a learning model • Firm adopts/develops a new technology • agent (manager) is informed about useful of technology • principal (CEO) is correctly aligned with owners incentives • Predictions are that in more volatile and younger industries technology more uncertainty – so more decentralization • AALVZ indeed find strong evidence that industry volatility (SD of levels and changes of TFP) and firm age ↑ decentralization
Other factors • Collection of other factors which have robust signs in AALZV (2007) and BSV (2009) • Size: larger firms and larger plants robustly more decentralization • Skills: firms with more education employees and more education managers more decentralized • Multinationals: controlling for size and industry, still more decentralized
Lecture 2: Overview • Measuring organization: spans and decentralization • Differences in organization across firms, countries & time • Factors driving the organization of firms • Organization and productivity • Conclusions
Two channels for the impact of decentralization (1/2) Firm size: Early work on the structure of firms argued that decentralization was critical for large firms, Penrose (1959) & Chandler (1962) Indeed, see that larger firms are more decentralized Essential for productivity growth as reallocation - which accounts for ≈¾ of US TFP growth - needs productive firms to grow Also important in development as low productivity due to lack of reallocation as too few large firms: e.g. Banerjee & Duflo, 2004; Hsieh & Klenow (2008) Pawasutipaisit & Townsend (2008) Hence, factors driving decentralization – trust, rule of law, competition – also drive growth via facilitating decentraliztion
Two channels for the impact of decentralization (2/2) Firm level productivity: Typically think of decentralization as a control variable – firms choose the right level – so not “right” or “wrong” level But this level may be hard to change, so can be “right” or “wrong” level in the short-run if situation changes Good example is IT – changed information flow around the firm, so changed optimal decentralization, so not all firms optimal Bresnahan, Brynjolfsson and Hitt (2002, QJE); Bloom, Sadun and Van Reenen (2009, NBER) find strong complementarity between IT and decentralization
Summary • Decentralization probably key organizational trait of firms • Varies by country – Northern Europe and North America decentralized, Southern Europe and Asian centralized • Varies by firm – high trust, strong rule-of-law, tough competition, rapid industry change and education all linked to decentralization • Essential for macro growth: firms need to decentralize to grow, and firm growth required for productivity enhancing reallocation • Important for firm level productivity of certain factors – e.g. IT 36
My five outstanding research questions • What fraction of the differences in TFP across firms and countries can organizational differences explain? • What are the key factors causing difference in organizations? • How quickly can firms change real organizational structures? • Is the optimal organizational structure changing over time, and if so why? • Why are academics so disorganized…. 37