Download
1 / 30
300 likes | 464 Views
Sensitivities of a Squall Line over Central Europe in a Convective-Scale Ensemble . K. E. HANLEY, D. J. KIRSHBAUM N., M. ROBERTS and G. LEONCINI Mon. Wea . Rev., 141 , 112–133 2013/04/23. Introduction (I).

E N D
Sensitivities of a Squall Line over Central Europe in a Convective-Scale Ensemble K. E. HANLEY, D. J. KIRSHBAUM N., M. ROBERTS and G. LEONCINI Mon. Wea. Rev., 141, 112–133 2013/04/23
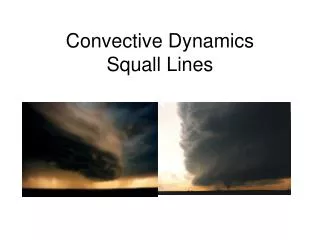
Introduction (I) • Even when the convection is driven mainly be synoptic-scale features, mesoscale and local-scale processes can still influence the exact location(s) and timing of initiation. • Although such grid spacing are able to explicitly represent large convective clouds, they fail to fully resolve important turbulent features at smaller scales that regulate cloud development and precipitation production (Bryan et al. 2003). • Convection-permitting models yield qualitatively more realistic precipitation fields and are quantitatively more skillful than lower-resolution simulations with parameterized convection.
Introduction (II) • The uncertainties in the large-scale meteorological conditions which can lead to errors in the moist instability and the vertical motions. • How subtle errors inherited through ICs and LBCs transfer down to the small scale. (Argence et al. 2008; Reinecke and Durran 2009; Hanley et al. 2011) • The role of large-scale uncertainties on the quantitative precipitation forecast (QPF) skill of a convective-scale ensemble.
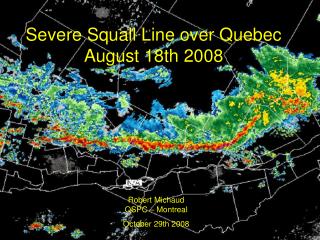
Convective and Orographically Induced Precipitation Study (COPS;Wulfmeyer et al. 2008)Schwitalla et al. (2008) 13 cases during summer 2005 of MM5 Precipitation is over-/under-estimated at windward/lee side Convection initiation occurred several hrs too early Peak rain rates were underestimatedModel errors of high-resolution (1-km) were strongly reduced than 7-km grid COPS high frequency of summertime convection initiation through slope and valley wind systems(Barthlott et al. 2006),but low skill of operational convection forecasts Rhine valley radiosondestation SWITZ. (瑞士) 中央高原
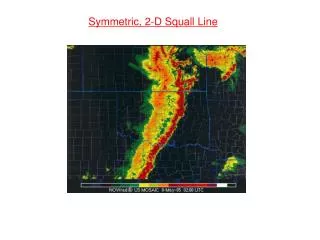
a. Operational analyses and observations Intensive Observing Period 9c (IOP9c) 2007/07/20 1000-500-hPa thickness500 hPa height surface cold frontmidlevel front 07/19 1800 UTC 07/20 0600 UTC
Rain rate (mm h-1) from the Met Office’s Nimrod system 07/20 0300 UTC 07/20 0700 UTC primary 07/20 1000 UTC 07/20 1100 UTC secondary
07/20 0800 UTC COPS radiosondestation a high-resolution COPS sounding from Burnhaupt le Bas at the southern end of the Rhine valley strong nocturnal inversion
b. Model description and ensemble setup Met Office Unified Model (MetUM) V7.3 • 12/4/1 km (150x150x38 / 370x300x70 / 300x190x70) • 38 terrain followed levels • One-way nested • LBC: NAE 0.22º (300 x 180 x 38 ) • IC: 24 members (23 have perturbed ICs and model physics) • Initial time: 1800 UTC, 19 July 2007 • Integration length: 3+24 h • Ensembles: MOGREPS North Atlantic European(NAE)Met Office Global and Regional Ensemble Prediction System(MOGREPS; Bowler et al. 2008)
2007/07/14 1100 UTCAchern (48.64N, 8.07E, 140 m amsl) from Hanley (2011)
07/20 1100 UTC Met Office’s Nimrod (5km) NAE-Control (4km) Pert06 (4km) Pert20 (4km)
07/20 1100 UTC DWD radar composite (2.8km) NAE-Control (1km) Pert06 (1km) Pert20 (1km) DeutscherWetterdienst (DWD)
07/20 1100 UTC of 1-km ensemble Control Pert06 Pert20 OBS Trails the observations by 50-200 km
a. The SAL (structure, amplitude, and location) method Wernli et al. (2008)
b. Accumulated rainfall 4-km ensemble 07/20 0800—1400 UTC 1-km ensemble The cumulative rainfall over the domain is larger when the precipitation is more widespread.
c. Instantaneous rainfall 4-km ensemble 24-km NAE ensemble 1-km ensemble mean DWD radar composite (2.8km) Pert06 Pert20
4-km ensemble 24-km NAE ensemble 1-km ensemble mean Pert06 Pert20 The convection over the COPS region was apparently linked to positional errors as the squall line entered the COPS domain through its lateral boundaries.
4-km ensemble 24-km NAE ensemble 1-km ensemble mean Pert06 Pert20
standard deviation of the SAL L1 component computed in (solid line) standard deviation of the SAL L1 component computed in normalized by the mean instantaneous rain rate (dashed line) mean Pert06 Pert20
07/20 0730 UTC Met Office’s Nimrod (5km) NAE control (4km) NAE-Pert06 (4km) NAE-Pert20 (4km) The primary squall-line initiation over France was critical for accurately simulating the 2nd squall line over the Black Forest.
Mechanisms and large-scale sensitivitiesa. Squall-line initiation Pert20 simulation @ 700 hPa on 4-km q (g/kg) 0400 UTC 0600 UTC 0730 UTC w (m/s)
cloud base near the center of developing squall line nearly adiabatic lifting: constant q as z increase Pert06 Pert03 Pert20 Pert10 Pert10 Pert03 Pert20 Pert06 verified well: Pert10 & Pert20verified poorly: Pert03 & Pert06
b. Composites composite A: verify well (Perts 04, 10, 20)composite B: verify poorly (Perts 02, 03, 06) 07/20 0600 UTC @ 700 hPa on 4-km q (g/kg) composite A (Perts 04, 10, 20) composite B (Perts 02, 03, 06) diff of composite A & B w (m/s)
07/20 0600 UTC @ pmsl composite A (Perts 04, 10, 20) Ter (km) composite B (Perts 02, 03, 06) diff of composite A – Met diff of composite B – Met P_diff (mb)
07/20 0600 UTC the midlevel front develops faster (strong geostrophic forcing)the MCS and midlevel front propagate faster to the east (stronger westerly advection over France)the moisture anomaly propagates more quickly northward (stronger southerly advection in the warm sector)
07/20 0600 UTC 07/19 2100 UTC 07/20 0600 UTC UK UK UK A PVU B A (increased upper-level forcing & low-level cyclogenesis) increased RT(2100-0600 UTC)over UK and northern France is 24% higher than B.the prefrontal convection developed earlier and farther to the east in A. PVU A-B
A-B A B
c. Ensemble sensitivity analysis pmsl @ 07/20 0600 UTC w @ 07/20 0600 UTC U700 @ 07/20 0600 UTC SAL L1@ 07/20 0900 UTC
Summary and conclusions (I) COPS • IOP9c (2007/07/20) of the COPS field campaign “primary” squall line developed ahead of a decaying MCS propagated over the COPS regiondissipated as it descended into the Rhine valley“secondary” squall line regenerated over Black Forest (low-level cold pool collided) • Ensembles captured the primary and secondary squall line: 1-2 h delay & led to a 50-150 km positional error over the COPSa phase error in the onset of intense precipitation • A few members of the 4- and 1-km are improved to predict the squall line timing and position, most members are still suffered from the positional and timing errors • This event was largely driven by synoptic-scale processes, the focus was placed on the sensitivity of the squall-line representation to uncertainties in broader meso- and synoptic-scale features. • A stronger initial PV gradient , a stronger jet streak rise to stronger ageostrophic ascent . The stronger geostrophic flow and faster cyclogenesis the development and propagation of both the midlevel frontal circulation and the midlevel moisture anomaly.
Summary and conclusions (II) • Events are broadly predictable at the synoptic scale may be significantly more uncertain at the convective scale. • Larger-scaleuncertainty:forecast error at lead times of 6-12 h and depends on the synoptic regime (Vie’ et al. (2011) and Gebh rdt et al. (2011)). • Convective-scale uncertainties:small-scale features and model-physics parameterizationslarge-scale uncertainties