Download
1 / 6
60 likes | 172 Views
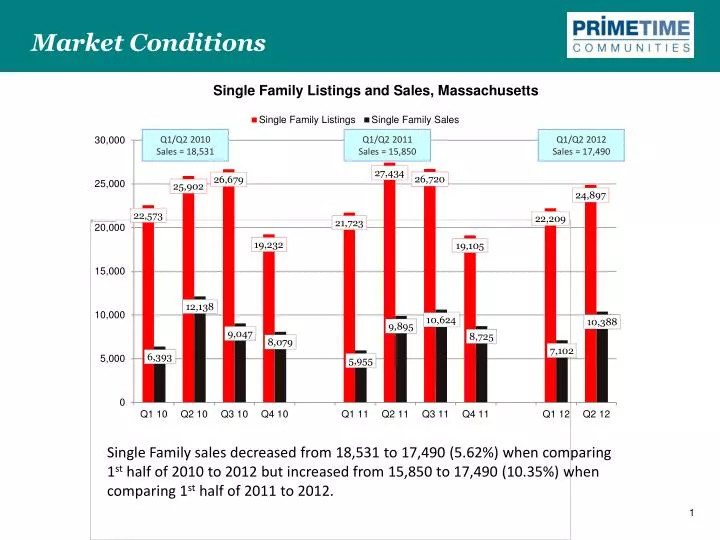
Market Conditions. Q1/Q2 2010 Sales = 18,531. Q1/Q2 2011 Sales = 15,850. Q1/Q2 2012 Sales = 17,490. Single Family sales decreased from 18,531 to 17,490 (5.62%) when comparing 1 st half of 2010 to 2012 but increased from 15,850 to 17,490 (10.35%) when comparing 1 st half of 2011 to 2012. 1.

E N D
Market Conditions Q1/Q2 2010 Sales = 18,531 Q1/Q2 2011 Sales = 15,850 Q1/Q2 2012 Sales = 17,490 Single Family sales decreased from 18,531 to 17,490 (5.62%) when comparing 1st half of 2010 to 2012 but increased from 15,850 to 17,490 (10.35%) when comparing 1st half of 2011 to 2012. 1
Market Conditions $373,931 Q1/Q2 2010 Average price $379,369 Q1/Q2 2011 Average price $367,474 Q1/Q2 2012 Average price The average sale price for Single Family sales decreased from $373,931 to $367,474 (1.73%) and $379,369 to $367,474 (3.14%) when comparing respectively the 1st half of 2010 and 2011 to 1st half of 2012. 2
Market Conditions The Average Days on Market of Single Family Homes is currently at 131, an indication that it is taking 4.3 months to sell a home.
Market Conditions Q1/Q2 2010 Sales = 8,232 Q1/Q2 2012 Sales = 7,066 Q1/Q2 2011 Sales = 6,636 Condo sales decreased from 8,232 to 7,066 (14.16%) when comparing 1st half of 2010 to 2012 but increased from 6,636 to 7,066 (6.48%) when comparing 1st half of 2011 to 2012. 4
Market Conditions $358,181 Q1/Q2 2011 Average price $367,377 Q1/Q2 2012 Average price $327,436 Q1/Q2 2010 Average price The average sale price for condominium sales increased from $327,436 to $358,181 (9.39%) and $ 327,436 to $367,377 (12.2%) when comparing respectively the 1st half of 2010 and 2011 to 1st half of 2012. 5
Market Conditions The Average Days on Market of Condominiums is currently at 116, an indication that it is taking 3.8 months to sell a home