Download

1 / 18
200 likes | 542 Views
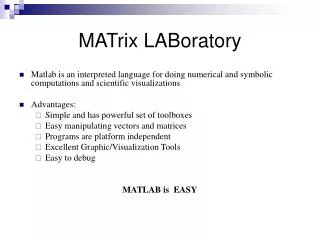
MATrix LABoratory. Matlab is an interpreted language for doing numerical and symbolic computations and scientific visualizations Advantages: Simple and has powerful set of toolboxes Easy manipulating vectors and matrices Programs are platform independent

E N D
MATrix LABoratory • Matlab is an interpreted language for doing numerical and symbolic computations and scientific visualizations • Advantages: • Simple and has powerful set of toolboxes • Easy manipulating vectors and matrices • Programs are platform independent • Excellent Graphic/Visualization Tools • Easy to debug MATLAB is EASY
Matlab Workspace • Workspace is area of memory accessible from command line • Check Variables in workspace • who: short list • Whos: long list with storage and size information • Clear Variables in workspace • clear x y: clears variables x and y from workspace • clear : will clear all variables in workspace • Save Variables in workspace • save sept17: saves workspace variables in file called sept17 Matlab is Case Sensitive
Basic Commands • cd: current directory • cd directory: change working directory • Editor • Type edit in the matlab workspace to bring up the matlab editor • edit myfile.txt : opens file in the matlab editor • Exclamation Point • Initiates a shell escape function • Input line is command to operating system • Quit Matlab • Type exit in the matlab workspace • Interrupt Matlab • cntrl-c: interrupts a ongoing calculation
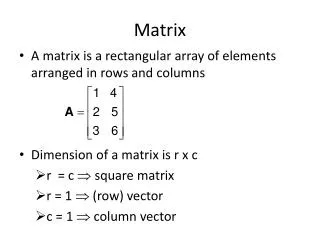
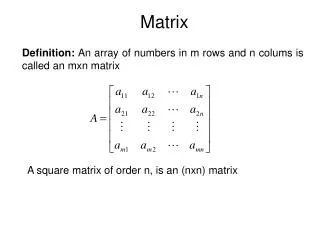
Basic Structure: MatrixmatrixName(row,column) • Creating a Matrix: • Comma or Space for entries on same row • Scalar: x=2; • Vector or 1-D matrix = x1 = [ 5 3 4] • For odd series: x = [1:2:10] = [1 3 5 7 9] • Carriage Return or Semicolons to separate rows • 2x2 matrix: x2 = [2 3; 3 4] • 3x3 matrix: x3 = [1 2 3; 4 5 6; 7 8 9] • x4(3,3,3)=0; • Parentheses used to index matrices and commas to separate dimensions • x3(2,1) = 4
Creating a Matrix(Using Built In Functions) • zeros (m,n): creates a mxn matrix of zeros • ones (m,n): creates a mxn matrix of ones • eye (n) : creates a nxn identity matrix • diag (r): creates a nxn diagonal matrix with r in the diagonal • rand (m,n): creates a mxn random number matrix from uniform distribution • randn (m,n): creates a mxn random matrix from normal distribution • magic (n): nxn square matrix
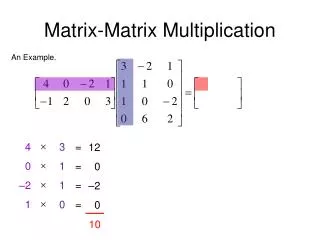
Matrix Operations • Multiplication, Addition, Subtraction • Add and Subtract require matrices to be of same size • X = [1 2; 3 3], Y = [ 4 5 ; 8 9] Z=X*Y or Z=X+Y or Z=X-Y • immultiply (X,Y) or X.*Y : element by element multiplication • Power: X^2 or X.^2 • Transpose: X’ • Inverse: inv (X) • Determinant: det (X) • Logarithm: log (X) • Exponential: exp(X) • Eigen Values: eig (X)
Control Structures • Loops • if <condition> <body> else <body> end • for <iterator> <body> end • while <condition> <body> end • Example • for k=1:10 • y(k) = exp(x); • x=x+0.01; • end Life is too short to waste it on for-loops: try to avoid them!
M-Files • Files ending with .m • Contains scripts or functions • Can be saved anywhere and called in matlab by adding to the search path • Executed by typing m-file name in workspace • Create Diary of a matlab session • diary myfile • diary on: starts log • diary off: ends log • Run Batch Jobs with M-Files • nice matlab < myfile.m >& myfile.out &
Descriptive Statistics • Maximum and Minimum of Sample • max (x) • min (x) • Mean and Median of Sample • mean (x) • median (x) • Percentiles • prctile (x, 50) • Correlation Coefficients • [R,P] = corrcoeff (x,y) • Variance of Sample • y = var (x) • Standard Deviation of Sample • y = std (x)
Hypothesis Testing • BOLD fMRI data was collected when subjects (N=10) looked at three kinds of stimuli: self face, familiar face and unfamiliar face. Mean Percent signal change from baseline was estimated from the Fusiform Gyrus region for the three stimuli • self = [ 1.20 1.53 2.33 2.55 2.63 2.88 3.19 2.31 1.51 1.78] • fam = [0.92 1.89 2.32 1.67 1.49 3.2 2.3 1.11 0.83 2.1] • ufam = [0.56 0.89 1.32 1.0 1.4 0.2 0.3 1.11 0.83 2.1 • T-test: • [test, p, ci] = ttest (self, 1, 0.05) • H0: mean = 1 • Test = 0 then do not reject H0 at alpha=0.05
Hypothesis Testing (contd.) • Anova: • H0: All the three means are equal • X=[self;fam;ufam]’; • [p,table,stat] = anova1(X); • Computes Anova table, F statistics and boxplots for all columns in X • anova2: 2-way anova • anovan: n-way anova • manova
Regression • Simple Linear Regression: • x=[1.0;2.3;3.1;4.8;5.6;6.3] • y=[2.6;2.8;3.1;4.7;5.1;5.3] • Coefficient = [inv (x’x)]x’y = 0.9379 • coeff = regress(y,x) = 0.9379 which is also same as x\y = 0.9379 • regstats : detailed output
Multiple Regression • Multiple Regression Using Least Squares: • X1 = [1 2 3 4 5 6 7 8 9 10]’; • Y = [2 0.3 5.2 7.8 12 12.1 14 15 18 19.9]’; • Model-1: Y = b1 + b2 X1 • Plot (X1,Y,’o’) • Create Design Matrix X = [ones(size(X1)) X1]; • [bhat bint R Rint Stats] = regress (Y,X,0.05) = [-1.1267 2.1376] • Least Squares Fit model is: Y = -1.1267 +2.1376 X1 • Add Autoregressive Component of order one • Model-2: Y = b1 + b2X1 + b3 Yx-1 + error, where x=2,3,…10 • Xar = [ones(9,1) X1(2:10) Y(1:9) ] • [b,bint] = regress(Y(2:10), Xar)
Plotting • Boxplots • boxplot (x) • Histograms • hist(x, nb) • nb is the number of bins (deault=10) • Scatter Plot or Bubble Graph • Scatter(x,y) • Creates a 2-d scatter plot • Multiple Plots • Different Plots: Use subplot(2,2,1) • Two plots on same plot: Use hold • Yfit = 1.1267 + (2.1376 * X1) • Hold on • Plot(X1,Yfit)
Plotting (contd.) • Linear plot • plot (x,y): 2-D line plot defined by vectors x and y • plot3(x,y,z): 3-D line plot connecting 3 vectors x, y and z • Plot functions: y = sin (x) on interval [0,10] • x = 0:.3:10; y = sin (x); plot (x,y) • Probability Plot • normplot (x): normal probability plot of data in vector x • probplot(‘distname’,y) : probability plot for the specified distribution • Quantile-Quantile Plot • qqplot (x,y): x and y are samples from same distribution
I/O Operations • Read files • load filename: loads entire file • importdata (‘filename’) • A= importdata (‘filename’,’delimiter’) • Write files • save filename: saves variables in workspace in a file specified • file operations: fopen – fprintf – fclose • sprintf • Example1 • A=[2 2; 3 3]; • fid = fopen(‘test.txt’, ‘a+’); fprintf(fid, ‘%d\n’, A(:,1)); fclose(fid); • Example2 • i=2 • fout = sprintf('myfile%03d.mat',i); save(fout, ‘A’);
HELP • To get help on the syntax for any command, type help <command> • Most commands have intuitive names; if you want to know how to find the mean of a vector • try help mean. • If you want a command that performs some function but you can’t think of the name of the command, use lookfor <keyword> • try lookfor xls. • Some useful commands: • find • why (answer to everything)
Websites • http://www.mathworks.com/ • Newsgroup: http://www.mathworks.com/matlabcentral/newsreader/ • File Exchange: http://www.mathworks.com/matlabcentral/fileexchange/