Download

1 / 37
370 likes | 477 Views
Problem Solving. A Systematic Approach. Six Steps. A. Problem Solving Steps. Systematic Approach. Define The Problem Analyze The Problem Generate Possible Solutions Select The Best Solution Plan For Implementation Implement And Evaluate The Solution. A. Problem Solving Steps.

E N D
Problem Solving A Systematic Approach
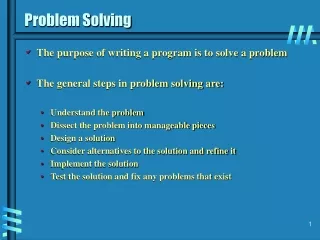
Six Steps A. Problem Solving Steps Systematic Approach • Define The Problem • Analyze The Problem • Generate Possible Solutions • Select The Best Solution • Plan For Implementation • Implement And Evaluate The Solution
A. Problem Solving Steps 1. Step One : Define The Problem • Identify the problem • Develop an accurate problem statement: • Too general or misleading: • - - Too broad. . . “Reduce the quality problems in our area”. • - - Implies a cause or suggests a solution . . . “There are not enough • forklifts to service the assembly line”. Accurate and Appropriate: “Reduce the downtime of the assembly line due to parts problems caused by inadequate restocking”.
A. Problem Solving Steps 2. Step Two : Analyze The Problem • Don’t rush to a wrong solution. • Highly critical step. • Common mistake to immediately • begin generating solutions. • Must identify and eliminate root • causes of problem.
A. Problem Solving Steps 2. Step Two : Analyze The Problem Examples: Symptoms and Root Causes Example 1 Symptom: The chicken on the grill is still frozen solid. Brute Force/Quick Fix: Apply a blow torch to the chicken. Root Cause: No allowance for time to defrost the chicken. Real Solution: Plan ahead. Allow defrost time or but fresh chicken. Example 2 Symptom: High error rate from Word Processing Center. Brute Force/Quick Fix: Add proofreaders. Hire high-level operator. Root Cause: Handwritten input drafts illegible. Real Solution: Do not accept illegible drafts. Encourage use of dictating equipment.
A. Problem Solving Steps 2. Step Two : Analyze The Problem Examples: Symptoms and Root Causes Example 3 Symptom: Pile-up of rework. Brute Force/Quick Fix: Add more rework operators. Root Cause: Incorrect assembly operators. Real Solution: Train assembly workers. Example 4 Symptom: High reject rate from plating area. Brute Force/Quick Fix: Add 100% inspection. Root Cause: Parts damaged in stockroom. Real Solution: Change handling methods in stockroom.
A. Problem Solving Steps 2. Step Two : Analyze The Problem Getting to the Root Cause of the Problem Five “Whys” equal one “How-To” (5W=1H) • Why did the machine stop? • An overload caused the fuse to blow. • Why did the overload occur? • The bearing was not sufficiently lubricated. • Why was it not lubricated sufficiently? • The lubrication pump was not pumping sufficiently. • Why was it not pumping? • The shaft of the pump was worn and rattling. • Why was the shaft worn? • Metal scraps got to the pump because no strainer was attached. This helps uncover the root problem and correct it.
A. Problem Solving Steps 2. Step Two : Analyze The Problem Preventing Problem Recurrence • One of four bolts keeps breaking. • The bolt is replaced with a larger bolt. • A second bolt starts breaking. • All four bolts replaced with larger bolts.. • Iron plate holding the bolts breaks in two. • Plate replaced with thicker plate. • Is recurrence prevented? NO! • Further study revealed vibration caused the problem. • Vibration was eliminated. • Is the cause prevented? NO! • Why was the vibration not detected? • Reevaluate test procedures to prevent recurrence.
A. Problem Solving Steps 2. Step Two : Analyze The Problem Diagnostic Tools (Described later in Techniques section) • Brainstorming • Flow Diagrams • Cause and Effect Diagrams • Pareto Charts • Check Sheets
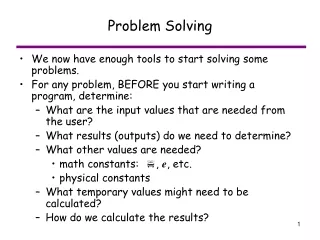
A. Problem Solving Steps 2. Step Two : Analyze The Problem Data Collection Ask yourself, “Once I collect this data, what am I going to do with the information? Steps to Data Collection: • Identify what information to collect. • When a cause/effect is occurring. • How frequently it is occurring. • Where it is occurring. • What is the magnitude of the occurrence?
A. Problem Solving Steps 2. Step Two : Analyze The Problem Steps to Data Collection: • 2. Decide how to collect the information. • Interviews and questionnaires (Technical Specialists, • Supervisors and Managers, other Employees) • Look at records (Past/ recent information, quality, • productivity, safety, inventory, maintenance records). • Direct observation (Make your own records, use those involved in • the problem).
A. Problem Solving Steps 2. Step Two : Analyze The Problem Steps to Data Collection: • 3. Decide when to collect the information. • Decide what is a reasonable time. • Consider when you are most likely to get the • information.
A. Problem Solving Steps 2. Step Two : Analyze The Problem Steps to Data Collection: • Design which tools you will use to collect the • information. • Interviews or questionnaires • Decide from whom you need information. • Determine what questions to ask. • Use checklists to collect two kinds of information • at the same time. • Think of combinations that show when and where • the cause is happening. • - - Number of times and places occurring • - - Length of time and type of thing • - - Cost and type • - - Machine and/or type of system 5. Collect the data.
A. Problem Solving Steps 3. Step Three : Generate Alternative Solutions How to Develop Alternatives: • Look at the data. What does it tell you? • - - Data will lead to some ideas • - - Data may not lead to best idea • Question each aspect of situation. • - - What is the job to be done? • - - Why is the job to be done? • - - Who should do the job? • - - Where should the job be done? • - - When should the job be done? • - - How should the job be done? • Use all idea sources available. • - - The worker involved. • - - In-house experts. • - - Written material • - - Outside experts
A. Problem Solving Steps 3. Step Three : Generate Alternative Solutions How to Develop Alternatives: (con’t) • Apply some appropriate action • - - Eliminate (part, reason, job, activity) • - - Combine (parts, forms, jobs, functions) • - - Rearrange (sequence, location) • - - Simplify (foolproof, make obvious, provide • interlocks, remove steps, reduce physical effort) • Apply creativity to the situation. • - - Making new ways • - - Rearranging old ways • - - Form novel and useful ideas • Brainstorm for alternative solutions.
A. Problem Solving Steps 3. Step Three : Generate Alternative Solutions Personal Skills for Working Together: • Keep an open mind • - - Avoid prejudging ideas • - - Avoid statements like: • ... “That won’t work here”. • ... “We already tried that”. • ... “That will cost too much”. • - - If other team members criticize: • ... Ask for suggestions and ideas • ... Ask for data • Pursue new ideas. • - - Thoroughly discuss ideas before moving on • - - Request input and participation from others • - - Remove obstacles
A. Problem Solving Steps 3. Step Three : Generate Alternative Solutions Personal Skills for Working Together: • Treat ideas equally. • - - Follow brainstorming rules • - - Better alternatives may emerge • - - At first, consider all alternatives • - - Look for most interesting aspect • - - Good ideas come from unexpected sources • - - Say ”What I like most about this idea is...” • Ask “good” questions. • - - Ask often for new ideas • - - Clarify – “What do you mean when you say...?” • - - Use “open” questions. Avoid “Yes” or “no” answers • - - Ask “What..., How..., Why...”?
A. Problem Solving Steps 3. Step Three : Generate Alternative Solutions Personal Skills for Working Together: • Listen with interest and respect • - - Restate ideas to show interest and understanding • - - Don’t interrupt • - - Use positive body language... Nod, smile, eye contact • - - Insist on truthful details... Ask • HOW DO YOU KNOW?
A. Problem Solving Steps 4. Step Four : Select A Solution • Refer back to original problem statement. Consider: • - - Safety • - - Cost • - - Product performance • - - Better management information • - - Improved Technology • - - Time • - - Quality • - - Appearance
A. Problem Solving Steps 4. Step Four : Select A Solution • Some questions to ask: • - - Will this completely resolve the problem? • - - Will this only satisfy part of the problem? • - - Will this prevent future occurrences? • - - Will this have little or no impact on the problem? • - - Do we have the authority to implement? • - - Do we have the necessary resources? • - - How long will it take to implement?
A. Problem Solving Steps 5. Step Five : Plan and Implement Solution • Steps to ensure successful implementation: • - - Work the most powerful forces • - - Prepare an action plan: • ... What will be done? • ... How will it be done? • ... Where will it be done? • ... Who will do it? • ... When will it be done? • - - Develop a tracking system: • ... Identify milestones or events • ... Assign completion dates • ... Identify reporting systems • - - Design evaluation procedures • - - Implement the procedures
A. Problem Solving Steps 6. Step Six : Evaluate The Solution • Measure results using procedures established • during implementation • Use data gathering: • - check sheets • - control charts • - time studies • - Pareto analysis
B. Problem Solving Techniques 1. Flow Diagrams • What is a “Flow Diagram”? • - A graphic representation of a process: May be... • - a physical product • - a service • - information • - or combination of the three. • A Flow Diagram examines the logic or lack • of logic in a sequence of steps. • A Flow Diagram gives team members a better • understanding of the process.
B. Problem Solving Techniques 1. Flow Diagrams • Symbols Used in Flow Diagramming: Terminal Symbol – Identifies “Start” or “End” of process. Activity Symbol – Indicates a single step in the process. Holding Step Symbol – Places in process where activity is temporarily halted. Decision Symbol – Indicates a decision or branch in process – Usually contain a Yes/No question. Connector Symbol – Indicates a continuation of the flow– Usually contain a letter or number. Flow Line Symbol – Indicates direction of flow of the process.
B. Problem Solving Techniques 1. Flow Diagrams • When to Use Flow Diagrams • - - Defining Projects • - - Identifying Root Causes • - - Designing Solutions • - - Implementing Solutions • - - Holding the gains (improvements)
B. Problem Solving Techniques 1. Flow Diagrams • Summary: How to Construct Flow Diagrams • - - Describe process as it really is. • - - Conduct group discussion and information exchange. • - - Consider intended use. • - - Be flexible • - - Decide on desired outcomes. • - - Define boundaries of process. • - - Document each step in process.
B. Problem Solving Techniques 1. Flow Diagrams • Summary: How to Construct Flow Diagrams (con’t) • - - Use appropriate symbols. • - - Draw process accurately (top to bottom or left to right) • - - Choose a branch and continue diagramming. • - - Repeat steps until entire process is diagrammed. • - - Review complete chart. • - - Discuss unfamiliar steps. • - - When diagram is complete – analyze it.
B. Problem Solving Techniques 1. Flow Diagram – Scrambled Eggs
B. Problem Solving Techniques 1. Flow Diagram – Team Formation/Operation
C. Brainstorming 1. Voting and Ranking Techniques Brainstorming and Cause/Effect analysis generate a large number of problem, ideas and alternatives. Techniques are needed to rank them in order of priority. 2. 5-3-1 Ranking Method • Each item assigned a value of 5, 3, 1, or 0 by each • team member. • Sum of values assigned by team members • represents team ranking of that item.
C. Brainstorming 3. 10 - 4 Ranking Method Helpful in eliminating items to reduce list. Reduced list can be prioritized using 5-3-1 method. • Each member allotted 10 points to assign in first round. • All ten may be assigned to one item if desired. • Members can assign only 4 points per item in following • rounds.
C. Brainstorming 4. Multi-voting Another way to reduce long list. • Members write down several items to address. • Tally votes from all members. • Eliminate items with fewest votes. • Repeat rounds until desired number reached.
D. Cause and Effect Diagrams Fishbone Diagram Wood Blocks
E. Pareto Charts Simple method to identify vital elements among many trivial elements. • Follow four steps: • Identify feature or attribute • (rejects, accidents, scrap, etc.) • List categories that • contribute to the feature. • Tabulate frequency of each • category. (List in descending • order) • Construct chart with • frequencies plotted in • descending order.
E. Pareto Charts Another chart: Same categories – different criteria. (cost)
E. Pareto Charts 1. Defect Location Check Sheets: Indicate on sketch or picture where defects are concentrated. Concentration of certain defects can help identify process errors. Rubber Glove Defects
Problem Solving Exercise “Lost at Sea” Work together as a team. Use the ranking methods discussed. Discuss your choices among the team. Do not look at the Answer/Rationale sheet.