Download
1 / 46
460 likes | 586 Views
Projected Climate Impacts and Adaptation Strategies for Wisconsin’s Urban Areas. UWM – School of Freshwater Sciences All Things Water September 14, 2010 David S. Liebl UW-Cooperative Extension, and UW-Engineering Professional Development. DNR. Photo: WDNR. Overview.

E N D
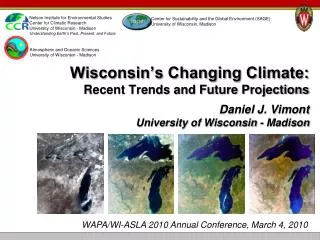
Projected Climate Impacts and Adaptation Strategies for Wisconsin’s Urban Areas UWM – School of Freshwater Sciences All Things Water September 14, 2010 David S. Liebl UW-Cooperative Extension, and UW-Engineering Professional Development DNR Photo: WDNR
Overview • Wisconsin’s Changing climate • Expected Impacts • How we can adapt
Recent Warming of the Atmosphere Source: IPCC 2007
Predicting Climate Change What General Circulation Models (GCMs) tell us Precipitation: Less certain and seasonally dependent Temperature: Warms by 2-6C (3-10F) by end of century Steve Vavrus, CCR
Adaptation: Wisconsin Initiative on Climate Change Impacts (WICCI) addresses ways toadapt to consequencesof climate change Acting on Climate Change in Wisconsin Mitigation: Governor’s Task Force on Global Warming addressed ways toreduce greenhouse gas emissions
Wisconsin Initiative on Climate Change Impacts (WICCI) www.wicci.wisc.edu WICCI was created by a partnership of the UW-Madison Nelson Institute for Environmental Studies and the Wisconsin Department of Natural Resources. Mission: Assess and anticipate climate change impacts on specific Wisconsin natural resources, ecosystems and regions. Evaluate potential effects on industry, agriculture, tourism, and other human activities. Develop and recommend adaptation strategies.
2008 1930 WI Cooperative Weather Stations Understanding our changing climate We’ve been measuring temperature and rainfall in Wisconsin since 1870
Change in Annual Average Temperature from 1950 to 2006 State average 1.5°F warmer (from Serbin and Kucharik 2009)
Change in the frequency of ≥90°F days per year from 1950 to 2006 Change in the frequency of <0°F nights per year from 1950 to 2006 Extreme Temperature Trends Very little change in hot summer days Decline in extremely cold winter nights, especially in northwest Wisconsin (from Serbin and Kucharik 2009)
Change in the Length of the Growing Season In Days from 1950 to 2006 Increase of up to 4 weeks (from Serbin and Kucharik 2009)
Change in Annual Average Precipitation (inches) from 1950 to 2006 Statewide 15%increase (but highly variable) (from Serbin and Kucharik 2009)
No reliable data Potter, et al.
Earlier arrival of spring in Wisconsin Source: Bradley et al., 1999 55 ecological indicators of spring occurred (on average) 1.2 days earlier per decade from 1936 to 1998. So…we live in a changing climate • What will the future bring?
IPCC 2007 Using Climate Models to Understand the Future • General Circulation Models (GCMs) • simulate the effects of incoming and outgoing thermal radiation on global climate, and include: • Atmosphere • Clouds • Oceans • Topography • Rainfall • Etc.
WCCI Climate Modeling • Used 14 Global Climate Models (GCM’s) from IPCC 2007 assessment • Verified using historical Wisconsin weather station data • Provides a statistical range of probable climate change Downscaled (8x8 km) grid GCM grid Downscaling: Focus global projections to a scale relevant to climate impacts in Wisconsin Source: Adapted from D. Vimont, UW-Madison
Downscaled GCMs vs. Historic data Wisconsin temperature and precipitation for 14 GCMs for 1980-1999 Black line = Observed temperature and precipitation Dave Lorenz
50% probability temperature (plotted on maps) Probability distribution of 14 GCM Projections 90% chance of exceeding this temperature 10% chance of exceeding this temperature Predicted Annual Temperature Change Projected Change in Annual Average Temperature (°F) from 1980 to 2055 Wisconsin projected to warm by 4 – 9 °Fby mid-21st Century Source: Adapted from D. Vimont, UW-Madison
Projected Change in Seasonal Temperatures 1980 to 2055 (°F) Winter Spring Warming is most pronounced in winter Summer Fall
Projected change in the frequency of <0°F nights per year from 1980 to 2055 Projected change in the frequency of ≥90°F days per year from 1980 to 2055 Projected Temperature Extremes Fewer extremely cold winter nights More hot summer days
Probability Distributions of 14 Climate Model Projections by Month Projected Change in Precipitation from 1980 to 2055 Change in Annual Average (inches) Models predict winter and early spring will be wetter Models uncertain about amount of summer rainfall Source: Adapted from D. Vimont, UW-Madison
2.42 inches 5.6 days/yr 1.0 days/yr 0.2 days/yr Increase in Intense Precipitation Increasing in frequencyModerate increase in intensity Steve Vavrus
Heaviest rainfall events (>5” in 24 hours) - Not predicted to increase substantially in number or intensity Potter, et al.
Predicted changes in monthly temperature and precipitation to 2090 David Lorenz, CCR A word about uncertainty Predicted changes in monthly temperature and precipitation to 2090 • While we cannot predict the future, we can estimate the risk (probability) from changing climate… • Understanding the risk and potential consequences supports good decision-making.
Summary of Predicted Climate • Confident in a rise in nighttime and winter temperatures • Expect a significant increase in rain during winter • Moderate increase in frequency and intensity of rainfall What does this mean for Wisconsin Communities?
Average temperatures increasing 4-9°F by 2050 = More Heat Waves WICCI Human Health Working Group
Warmer summers = Reduced Air Quality Projected increases in ozone in Chicago (Source: Holloway et al. 2008)
High Water Impacts June 1-15, 2008 • 38 River gauges broke records • 810 Square miles of land flooded • 161 Communities overflowed 90 million gallons raw sewage • 2,500 Drinking water wells tested - 28% contaminated • $34M in damage claims paid Source: FEMA, WEM
Photo: Robert Mckean / Zuma Press Photo: WDNR Urban Flooding • Flooding of streets, homes and businesses may become more frequent as rainfall patterns change. • Critical infrastructure is also at risk from high water events, e.g. City of Reedsburg POTW required $800K in repairs.
Upland runoff and sanitary sewer overflows - Drinking water contamination - Beach closures - Wetland and aquatic habitat damage
Changing lake levels Lake Superior “The general scientific consensus is that water levels of Lake Michigan and Lake Superior will decline on average.. ...while continuing to exhibit large inter-decadal variation, as in the past 100 years.” - WICCI Coastal Communities Working Group Lake Michigan
Coastal Erosion Warmer and wetter winters = - Increased infiltration; - More freeze/thaw cycles; - Increasing coastal erosion; - Bluff collapse and landslides. Photos: D. Mickelson
How will Wisconsin adapt to climate change? Photo: WDNR
Heat waves Low lake levels Adapting to Climate Change Humans have always adapted to climate. But predicted changes lead us into unknown territory.
WICCI and Adaptation • Mitigation is the idea that we can avoid, prevent or minimize undesirable things happening in the future. • Adaptation is the idea that changes are occurring or will occur, and we can manage the impacts of those changes. • WICCI recommends a risk management approach • Climate presents hazards of varying severity and likelihood. • Encourage no-regrets strategies • - Clear present benefit • - Building future capacity • - Don’t gamble on uncertainty • - Flexibility to respond to new information
Successful Adaptation Strategies • Update our design process • Identify our vulnerabilities • Long-range planning • Education and research • Better information
Our designs are based on experience (i.e. history) The records used may actually reflect a drier period (1938-1958). We are designing for a historic climate.
Photo: DNR Heavy RainfallBetween 1950 and 2007 more than 135 rainfall events greater than 5" were recorded across the state. Heavy rainfall can happen anywhere, now and in the future. Liebl and Schuster
Photo: City of Antigo Photo: Joe Koshollek, Milwaukee Journal Sentinel Vulnerability Analysis • “Build upon the experiences of communities that have experienced recent extreme rainfalls to guide a state-wide evaluation of vulnerabilities…..” - WICCI Stormwater Working Group • Consider: • Floodplains and surface flooding • Areas of groundwater flooding • At-risk road-crossings • Stormwater BMPs • Sanitary sewer inflow and infiltration • Emergency response capacity • Wells and septic systems • Hazardous materials storage
Promote long-range planning • - Planning for impacts 25 or 50 years out is challenging • - Adaptation to low-risk, high-cost events requires political support • - Use simulations to understand high water impacts • - The next generation of planners needs to be trained today
Education and Research • - Periodically reevaluate and revise climate and hydrologic design models and criteria. • - Develop tools to distinguish the hydrologic effects of human activities from climate change. • - Evaluate and improve strategies for managing high water. • - Establish curriculum to build professional capacity among water resource managers.
Better Information is Needed • - Real time stream-flow data • - Robust groundwater monitoring • - Fine scale rainfall data • - Detailed understanding of sub-watershed characteristics • - Updated estimates of flood profiles
Adaptation Strategies for Milwaukee - WICCI Milwaukee Working Group
Funded by NOAA through Wisconsin Sea Grant, with UW-Extension and UW-Madison College of Engineering Assistance to communities • Extension outreach to provide local decision-makers with climate adaptation capacity. • Identify areas and infrastructure in the community that are vulnerable to large storm events. • - Economy • - Environment • - Infrastructure • - Land use
WICCI Take-home Messages • Our climate has and will continue to change. • Wisconsin’s urban communities are vulnerable. • We have adapted, and can continue to adapt: • Update our design process • Identify our high water vulnerabilities • Long-range planning • Education and research • Better information
Synthesis of climate impact assessments by WICCI Working Groups. Initial recommendations on adaptation strategies for decision-makers. www.wicci.wisc.edu