Download
1 / 21
210 likes | 288 Views
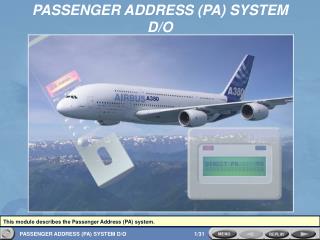
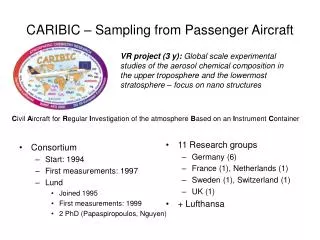
PASSENGER O-D TRIP TABLE FROM FAREBOX RECEIPTS. Kelly Chan k elly.chan@hdrinc.com. 2013 GIS in Transit Conference, October 16, 2013. Up-Down method for trip length < 0.5% adult passengers, ~ 3% student passengers

E N D
PASSENGER O-D TRIP TABLE FROM FAREBOX RECEIPTS Kelly Chan kelly.chan@hdrinc.com 2013 GIS in Transit Conference, October 16, 2013
Up-Down method for trip length • < 0.5% adult passengers, ~ 3% student passengers • Richardson, AJ (2003). “Estimating Average Distance Travelled from Bus Boarding Counts.” Paper presented at the 82nd Annual Meeting of the Transportation Research Board, Washington, DC. The Urban Transport Institute. • Société de transport de l’Outaouais (STO, Gatineau, Québec) • 66% success • Trépanier, M, Tranchant, N, and Chapleau, R (2007). “Individual Trip Destination Estimation in a Transit Smart Card Automated Fare Collection System,” Journal of Intelligent Transportation System, 11: 1, 1-14. • Barry JJ, Freimer R, and Slavin H (2009). “Use of Entry-Only Automatic Fare Collection Data to Estimate Linked Transit Trips in New York City,” Transportation Research Record: Journal of the Transportation Research Board, No 2112, pp. 53-61.
Data sources for trip table On-Board Survey Intercept Interviews Passenger Count Manual Counting Automated Counting • Approximately 2,500 trips per day • (6 am ― 3 pm) • Approximately 500 buses • Approximately 2,000 – 3,000 staff-hours to have 70% coverage
Data warehouse FAREBOX: GIS Data: ROUTES: STOPS:
How to build a trip table On-Board Survey Expensive Infrequent Time consuming Small sample size APC (Automated Passenger Counts) Trip ends not connected • Farebox Records • Origins only • Time of boardings • Location of boardings • Linkages of other data • Thousands of records per day
Distance • Opportunities • ElapsedTime
OCTA Advantages: • Data availability • 365 days, 24 hr/day, Free data (collected anyway) • Operational practicality
Demographics and socio-economic data • Automobile Ownership • Activities • Trip purposes • Mode Choices • Multi-modal • “park-and-ride” • Inter-system transfers
Jim Sterling, jsterling@OCTA.net Kelly Chan,kelly.chan@hdrinc.com tobias.wolf@hdrinc.com