Download
1 / 21
210 likes | 341 Views
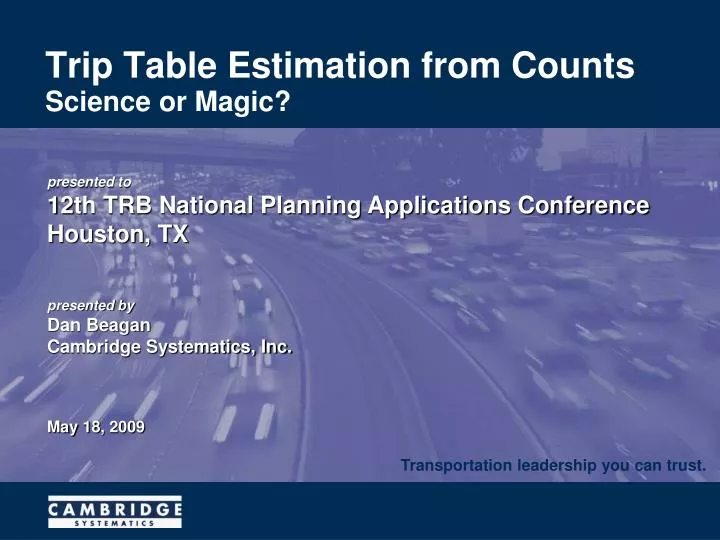
Trip Table Estimation from Counts. Transportation leadership you can trust. Science or Magic?. presented to 12th TRB National Planning Applications Conference Houston, TX presented by Dan Beagan Cambridge Systematics, Inc. May 18, 2009. Science vs. Magic.

E N D
Trip Table Estimation from Counts Transportation leadership you can trust. Science or Magic? presented to12th TRB National Planning Applications ConferenceHouston, TX presented byDan BeaganCambridge Systematics, Inc. May 18, 2009
Science vs. Magic • Any sufficiently advanced technology is indistinguishable from magic • Arthur C. Clarke, “Profiles of The Future,” (Clarke’s third law) • When a distinguished but elderly scientist states that something is possible, he is almost certainly right. When he states that something is impossible, he is very probably wrong • Arthur C. Clarke, “Profiles of The Future”, (Clarke’s first law)
Science vs. Magic Science If results are unexpected, the expectations were wrong Will always duplicate results Works for believers and non-believers Magic • If results are unexpected, the conditions for the spell weren’t “right” • Not expected to duplicate results • Works only for believers
Transportation Planning • Expected to be based on science • Most methods accepted as scientific • Trip Table Estimation from counts not always accepted • Method not always understood –”If you can believe results” • Method is widely available • Included in standard software packages
Software Packages • Caliper TransCAD’s ODME • Citilab CUBE ANALYST’s ME • PTV VISUM’s TFlowFuzzy
Scientific JustificationTrip Table Estimation from Counts • Statistical Principle behind Maximum Entropy • Maximum Entropy Techniques in Transportation • Applications of Matrix Estimation from Counts
Maximum Entropy • Most probable state is the one with the Maximum Entropy • Statistically, for a given macrostate, the most probable mesostate is the one with the maximum number of microstates
Game of Dice In “craps” (macrostate) the most probable roll (mesostate) is a seven, a natural, because there are more ways (microstates)to make a seven than any other roll
The economic impact of three individuals traveling from one home to three geographically different jobs (microstates) may not be the same, but the traffic impact of the trip table (mesostates) is identical Trip Tables Job 1 Job 1 Job 1 Larry Curly Moe Larry Moe Moe HOME HOME HOME Job 2 Job 2 Job 2 Curly Curly Larry Job 3 Job 3 Job 3 MICROSTATE 1 MICROSTATE 2 MICROSTATE 3 Job 1 Job 1 Job 1 Curly Larry Moe Curly Larry Curly HOME HOME HOME Job 2 Job 2 Job 2 Larry Moe Moe Job 3 Job 3 Job 3 MICROSTATE 4 MICROSTATE 5 MICROSTATE 6
A solution trip table, t ij, given an existing trip table, T ij, will be a maximum entropy trip table, if the following equation is solved The solution will depend on the constraints imposed Trip Tables Maximum Entropy 9
Trip Tables Maximum Entropy • Solving for the trip table relies on the following mathematical principles • The maximum of any monotonically increasing function of tij will have the same solution trip table, tij • Sterling’s approximation of X !, X ln X – X, is a monotonically increasing function • LaGrangian multipliers can be used to combine the target and constraint equations 10
Fratar Growth Factor • For an existing table, Tij, find a new table, tij, given growth targetsoi for the origins anddj for the destinations • Also known as Furness or IPF, Iterative Proportional Fitting • Choose values for K’i; solve for K’’j, resolve for K’j;iterate
A. G. Wilson’s Gravity Model • Traditionally there is no initial table, Tij, so Tij =1 • Total cost, C, does not need to be known • Choose values for K’i, solve for K’’j, then K’i and iterate 12
Logit Mode Split • Traditionally there is no initial Table, Tm, so Tm =1 • Indices are modes m for each ij pair • Total utility, U, does not need to be known • Stating the solution as a percentage eliminates the constants 13
Matrix Estimation from Counts • A “seed” table, Tij, may be available; otherwise Tij = 1 • Constraints exist for those links a which have counts, Va • The probability of traveling between pair ij on link a, pija can be found from assignment scripts • E.g., for AON, pija = 1 when link a is on the path between i and j • A set of simultaneous equations, which can be solved iteratively, can be developed by substituting the solution into the constraints 14
(OD)ME Trip Table • What should you use for the initial trip table? • Invariant to Uniform Scaling • How many counts and where should they be located? • Network Sensor Location Problem • How good is the solution? • Maximum Possible Relative Error • How well does the solution table validate to counts? • Maximum Entropy 15
(OD)ME Trip Table Applications • Subareas • TAZs are small • Many traffic counts / turning movements available • The seed trip table might be disaggregated from a regional travel demand model • Examples • Traffic Microsimulation OD tables • Traffic Impact Reports 16
(OD)ME Trip Table Applications • Truck tables in TDF Models • Behavioral based trip table for autos or freight OD table • Highway network for assignment • Sufficient link counts for trucks • Examples • Indiana DOT • Virginia DOT • Nashville MPO • New York City MPO • Binghamton MPO 17
(OD)ME Trip Table Applications State and multistate models No behavioral based trip tables for autos or trucks Highway network for assignment Sufficient link counts Examples Georgia DOT Tennessee DOT I-95 Corridor Coalition Appalachian Regional Commission 18
Trip Table Estimation from Counts Transportation leadership you can trust. Science or Magic? presented to12th TRB National Planning Applications ConferenceHouston, TX presented byDan BeaganCambridge Systematics, Inc. May 18, 2009