Download
1 / 39
390 likes | 521 Views
Challenges of Nowcasting. by George A. Isaac 1 , Monika Bailey 1 , Faisal Boudala 1 , Stewart Cober 1 , Robert Crawford 1 , Ivan Heckman 1 , Laura Huang 1 , Paul Joe 1 , Jocelyn Mailhot 2 , Jason Milbrandt 2 , and Janti Reid 1

E N D
Challenges of Nowcasting by George A. Isaac1, Monika Bailey1, Faisal Boudala1, Stewart Cober1, Robert Crawford1, Ivan Heckman1, Laura Huang1, Paul Joe1, Jocelyn Mailhot2, Jason Milbrandt2, and Janti Reid1 1Cloud Physics and Severe Weather Research Section, Environment Canada 2Numerical Weather Prediction Research Section, Environment Canada Workshop on Use of NWP for Nowcasting Boulder, Colorado, 24-26 October 2011
Introduction • Results from Canadian Airport Nowcasting (CAN-Now) and Science of Nowcasting Olympic Weather for Vancouver 2010 (SNOW-V10) • Funding from Environment Canada, NAV CANADA, SAR-NIF, Transport Canada
Canadian Airport Nowcasting (CAN-Now) • To improve short term forecasts (0-6 hour) or Nowcasts of airport severe weather. • Develop a forecast system which will include routinely gathered information (radar, satellite, surface based data, pilot reports), numerical weather prediction model outputs, and a limited suite of specialized sensors placed at the airport. • Forecast/Nowcast products are issued with 1-15 min resolution for most variables. • Test this system, and its associated information delivery system, within an operational airport environment (e.g. Toronto and Vancouver International Airports ). Isaac et al., 2011: The Canadian Airport Nowcasting System (CAN-Now, Submitted to Meteorological Applications Isaac et al., 2011: Decision Making Regarding Aircraft De-Icing and In-Flight Icing Using the Canadian Airport Nowcasting System (CAN-Now), SAE 2011 International Conference on Aircraft and Engine Icing and Ground Deicing, 13-17 June 2011, Chicago, Illinois, USA
Main equipment at Pearson at the old Test and Evaluation site near the existing Met compound
SNOW-V10Science of Nowcasting Olympic Weather – Vancouver 2010 Olympics Societal Benefits To improve our understanding and ability to forecast/nowcast low cloud, and visibility. To improve our understanding and ability to forecast precipitation amount and type. To improve forecasts of wind speed, gusts and direction. To develop better forecast system production systems. Assess and evaluate value to end users. To increase the capacity of WMO member states.
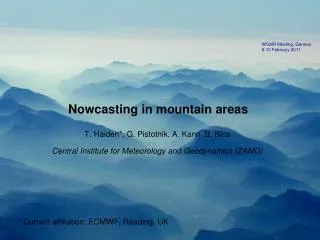
The Winter Olympic Challenge Steep topography, highly variable weather elements in space and time Village Creekside 5 km
Google Map of Outdoor Venues for Sochi 2014 Olympics. A box 7 km in size is drawn on map. The tops of the mountains are approximately 2200m and the valley 600 m. The area is about 35 km inland from Black Sea.
Products During Olympics • Each group produced a Table showing 24 hour forecast of significant variables for main venue sites (hourly intervals and 10 to 15 min intervals in first two hours). Similar to what forecasters produce • A Research Support Desk was run during Olympics and Paralympics (virtual and on-site) providing real time support to forecasters. • A SNOW-V10 Web site was created with many of the products (time series for sites, remote sensing products, area displays, soundings (gondola and others), and a very successful Blog.
Equipment on Whistler mountain provided good data for forecasters and help in understanding weather processes Harvey’s Cloud
Current Observation Adaptive Blending of Observations and Models (ABOM) Forecast at lead time p Change predicted by model Change predicted by obs trend • Coefficients s and r are proportional to the performance over • recent history, relative to obs persistence (w) and to • Local tuning parameters (not yet optimized at all SNOWV10 sites) • Updated using new obs data every 15 minutes • ABOM reduces to: • Observation persistence when r = s = 0, w = 1 • Pure observation trend when r = 0, s = 1, w = 0 • Model + obs trend + persistence for all other r, s and w Bailey ME, Isaac GA, Driedger N, Reid J. 2009. Comparison of nowcasting methods in the context of high-impact weather events for the Canadian Airport Nowcasting Project. International Symposium on Nowcasting and Very Short Range Forecasting, Whistler, British Columbia, 30 August - 4 September 2009.
Temperature Mean Absolute Error: Averaged by Nowcast Lead Time to 6 Hours • Nowcast - Model crossover lead-time • Improvement over persistence
Background of INTW INTW refers to integrated weighted model LAM 1k, LAM 2.5k, REG15k and RUC (CAN-Now) were selected to generate INTW Major steps of INTW generation Data pre-checking - defining the available NWP models and observations Extracting the available data for specific variable and location Calculating statistics from NWP model data, e.g. MAE, RMSE Deriving weights from model variables based on model performance Defining and performing dynamic and variational bias correction Generating Integrated Model forecasts (INTW) Huang, L.X., G.A. Isaac and G. Sheng, 2011: Integrating NWP Forecasts and Observation Data to Improve Nowcasting Accuracy, Submitted to Weather and Forecasting
Aerials’ jump Spectator grandstand Preparation of field-of-play 2 hours before training…
Freestyle Skiing Ladies Aerials Final February 24, 2010 Notes by Mindy Brugman as posted on SNOW-V10 Blog The event….Last night at the Cypress aerial site it began with drizzle and was quite foggy… We walked to the bright lights of the venue. There was no precipitation at the venue the entire competition. The competition started at 1930 PST. The first pictures (not shown here) are taken at the start of the competition and you can see that the fog was much worse at the start. I stopped taking pictures since I could not see anything. Then it began to clear just near the end of the competiton – and I clicked a few pictures. You can detect a flying bug above the lights. Thats really the gold medal winner, Lydia Lassila, of Australia! Based on the event last night – I suspect ladies aerials may qualify as a new paralympic sport for the visually impaired.
Total precip rate REG 15K including 24 hours before ladies aerials
NWP Model with Minimum MAE in CAN-Now for Winter Dec 1/09 – Mar 31/10 and Summer June 1/10 to Aug 31/10 Periods Based on First 6 Hours of Forecast
Winter period – Dec. 1, 2009 to Mar. 31, 2010 • Summer period - June 1 to August 31, 2010
Time (h) for Model to Beat Persistence 6h RUC Used Winter Summer Huang, L.X., G.A. Isaac and G. Sheng, 2011: Integrating NWP Forecasts and Observation Data to Improve Nowcasting Accuracy, Submitted to Weather and Forecasting
Observation – Model grid match RUC temperature at CYVR July 2010 • Compared data from 3 model points • Consider season when selecting the best point • CAN-Now: usually nearest grid point (with no water mask) J. Reid 2010
j i Heidke Skill Score: Multi-Categories Using: Observed category Forecast Category Calculate:
Summary of HSS/ACC results CYYZ (Winter) • Scores dominated by long periods of non-events • Relaxed timing: No clear changes, for better or worse • Similar results at CYVR J. Reid 2010
NWP Model with Highest HSS Score During SNOW-V10 LAM 1km - 40 LAM 2.5km - 23 GEM-15km - 7
Summary RH predictions are poor, barely beating climatology. (Impacts visibility forecasts) Visibility forecasts are poor from statistical point of view. (also require snow and rain rates) Cloud base forecasts, although showing some skill, could be improved with better model resolution in boundary layer. Wind direction either poorly forecast or measured. There are many difficulties in measuring parameters, especially precipitation amount and type. Overall statistical scores do not show complete story.Need emphasis on high impact events. Selection of model point to best represent site is a critical process.
Summary (continued) Weather changes rapidly, especially in complex terrain, and it is necessary to get good measurements at time resolutions of at least 1 -15 min. CAN-Now and SNOW-V10 attempted to get measurements at 1 min resolution where possible. Because of the rapidly changing nature of the weather, weather forecasts also must be given at high time resolution. Verification of mesoscale forecasts, and nowcasts, must be done with appropriate data (time and space). Data collected on hourly basis are not sufficient. Nowcast schemes which blend NWP models and observations at a site, outperform individual NWP models and persistence after 1-2 hours.