Download
1 / 8
80 likes | 223 Views
Statistical Counters. A brief look at our Intel gigabit ethernet network controller’s ‘event-counting’ registers. Statistics registers.

E N D
Statistical Counters A brief look at our Intel gigabit ethernet network controller’s ‘event-counting’ registers
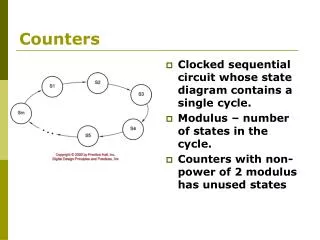
Statistics registers • The 82573L has several dozen statistical counters which automatically operate to keep track of significant events affecting the ethernet controller’s performance • Most are 32-bit ‘read-only’ registers, and they are automatically cleared when read • Your module’s initialization routine could read them all (to start counting from zero)
Initializing the nic’s counters • The statistical counters all have address- offsets in the range 0x04000 – 0x041FF • You can use a very simple program-loop to ‘clear’ each of these read-only registers // Here ‘io’ is the virtual base-address of the nic’s i/o-memory region { int r; // clear all of the Pro/1000 controller’s statistical counters for (r = 0x4000; r < 0x41FF; r += 4) ioread32( io + r ); }
A few ‘counter’ examples 0x4000 CRCERRS CRC Errors Count 0x400C RXERRC Receive Error Count 0x4014 SCC Single Collision Count 0x4018 ECOL Excessive Collision Count 0x4048 XONRXC XON Received Count 0x404C XONTXC XON Transmitted Count 0x4050 XOFFRXC XOFF Received Count 0x4054 XOFFTXC XOFF Transmitted Count 0x4074 GPRC Good Packets Received 0x4078 BPRC Broadcast Packets Received 0x407C MPRC Multicast Packets Received 0x40D0 TPR Total Packets Received 0x40D4 TPT Total Packets Transmitted 0x40F0 MPTC Multicast Packets Transmitted 0x40F4 BPTC Broadcast Packets Transmitted
A few 64-bit counters • Some of the events being counted by the NIC occur too frequently for a 32-bit count to provide reliable accuacy (i.e., ‘overflow’) • In such cases a pair of adjacent registers provides the upper-and-lower halves of a 64-bit (i.e., quadword) statistical counter: E1000_TORL Total Octets Received Low E1000_TORH Total Octets Received High E1000_TOTL Total Octets Transmitted Low E1000_TOTH Total Octets Transmitted High
Our ‘nicstats.c’ module • We wrote this kernel module for easily viewing the statistical counter values: $ cat /proc/nicstats • It led us to the discovery of one ‘mystery counter’ not mentioned in Intel’s manual • Can you solve that mystery?
‘nicstats2.c’ • This enhanced version of our ‘nicstats.c’ module shows names of all the counters • It uses some programming ideas that you may find useful in case you wish to create your own Linux software tools for studying some other hardware devices in the future
ACM Event • Tonight’s class will conclude early so that students can attend tonight’s event which our ACM Student Chapter has organized: 823 Clement Street (near 9th Ave) San Francisco, CA 94118 Cost is $7-per-person