Download

1 / 11
110 likes | 222 Views
Consumer Prices and Unemployment. Gary Steelman Jeff Smith. 11/28/2011 Semantic Web @ UTD, Dr. Steven Seida. Introduction to CPI. The Consumer Price Index (CPI) is a numeric value that represents the current price of an item(s) relative to the price in some base year.

E N D
Consumer Prices and Unemployment Gary Steelman Jeff Smith 11/28/2011 Semantic Web @ UTD, Dr. Steven Seida
Introduction to CPI • The Consumer Price Index (CPI) is a numeric value that represents the current price of an item(s) relative to the price in some base year. • EX: If the CPI of peanut butter in 1984 is 100 and the CPI of peanut butter in 2000 is 150, then the price of peanut butter increased by 50% between 1984 and 2000. • Provided by the Bureau of Labor Statistics (BLS).
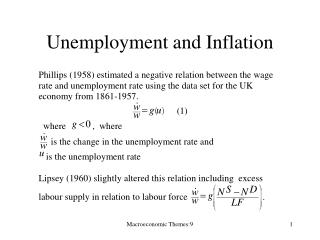
Introduction to LAUS • Local Area Unemployment Statistics (LAUS) provides monthly average estimates for: • Labor Force • Total number of people that could be legally employed. • Employment • Total number of people who are legally employed. • Unemployment • Total number of people who are unemployed. • Unemployment Rate • Percentage of labor force that is unemployed. • Provided by the BLS.
Correlation Value • Each of the CPI and LAUS statistics are individually useful • Can extrapolate future values based on history and find trends in the data. • Correlation of the CPI and LAUS values could potentially be even more useful. • Predict CPI based on LAUS values and vice versa. • See trends in statistics • Does an increase in the price of peanut butter correlate to increased unemployment? If so, we’d better keep a close eye on the price of peanut butter!
CPI Data Specifics • The CPI data contains cost values for many different items from foodstuffs to telephone communications to transportation to clothing and many subcategories • The full list is available on the project webpage in the Consumer Price Index box. • Notable vocabulary includes • From http://data-gov.tw.rpi.edu/vocab/p/316/ • item_name, item_code • period, year, value • area_name, area_code • series_id • A unique identifier for a series of data that must be constructed based on the item code, area code, period, and other factors.
LAUS Data Specifics • The LAUS data contains values for four measurements: labor force, employment, unemployment, and unemployment rate. • Unemployment Rate = 100*(Unemployed/LaborForce) • Notable vocabulary includes • From http://data-gov.tw.rpi.edu/vocab/p/316/ • measurement_text, measurement_code • period, year, value • area_name, area_code, area_type_code • series_id • A unique identifier for a series of data that must be constructed based on the item code, area code, period, and other factors.
Integration Approach Idea • Show data sets individually because each set is individually useful. • Initially used a Google Visualization LineChart • Knowing the dates for values is useful, switched to AnnotatedTimeLine • Show data sets mashed together • Scatter plot with each (x,y) point as the (CPI,LAUS) value for the same time period (i.e. January 2005) • Can interpolate a line through the scatter plot to view trends in the plot.
Integration Approach • Complete the tutorial here. • Enhance the demonstration by creating a LineChart showing the frequency of earthquakes by region as well as the GeoMap showing the earthquake locations. Enhance demo with formatting and colors. Artifact here. • Alter layout of page to show more data to the user at one time. Switch data set and queries to include CPI data. Add in details, queries, etc. information sections. Artifact here. • Add better formatting and color indication for query success/failure. Add chart for LAUS values. Artifact here. • Add ScatterPlot for comparing the CPI and LAUS values. Artifact here. • Debug, fill in details sections on page. Make it presentable.
Live demonstration • http://dl.dropbox.com/u/47561249/index.html
Sources • Data-Gov Tutorials: http://data-gov.tw.rpi.edu/wiki/Tutorials • Data-Gov CPI: http://data-gov.tw.rpi.edu/wiki/Dataset_320 • Data-Gov LAUS: http://data-gov.tw.rpi.edu/wiki/Dataset_330 • BLS CPI: http://www.bls.gov/cpi/ • BLS LAUS: http://www.bls.gov/lau/ • Wiki CPI: http://en.wikipedia.org/wiki/Consumer_price_index
End of Presentation • Questions?