Download
1 / 1
10 likes | 94 Views
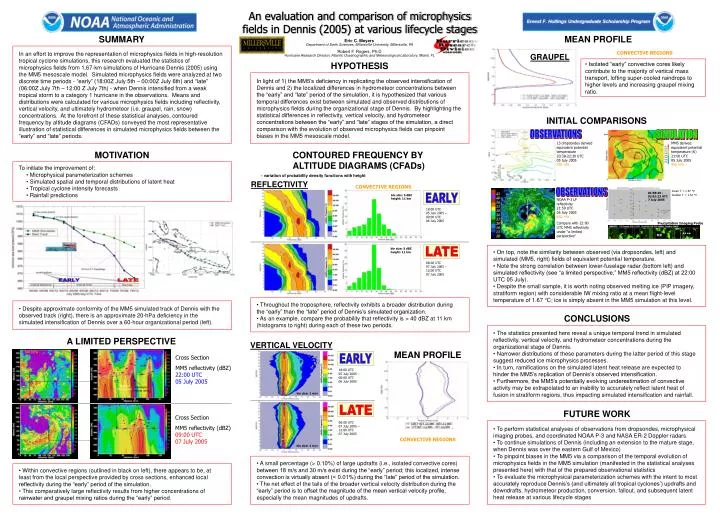
Isolated “early” convective cores likely contribute to the majority of vertical mass transport, lofting super-cooled raindrops to higher levels and increasing graupel mixing ratio.

E N D
Isolated “early” convective cores likely contribute to the majority of vertical mass transport, lofting super-cooled raindrops to higher levels and increasing graupel mixing ratio. In an effort to improve the representation of microphysics fields in high-resolution tropical cyclone simulations, this research evaluated the statistics of microphysics fields from 1.67-km simulations of Hurricane Dennis (2005) using the MM5 mesoscale model. Simulated microphysics fields were analyzed at two discrete time periods - “early” (18:00Z July 5th – 00:00Z July 6th) and “late” (06:00Z July 7th – 12:00 Z July 7th) - when Dennis intensified from a weak tropical storm to a category 1 hurricane in the observations. Means and distributions were calculated for various microphysics fields including reflectivity, vertical velocity, and ultimately hydrometeor (i.e. graupel, rain, snow) concentrations. At the forefront of these statistical analyses, contoured frequency by altitude diagrams (CFADs) conveyed the most representative illustration of statistical differences in simulated microphysics fields between the “early” and “late” periods. • On top, note the similarity between observed (via dropsondes, left) and simulated (MM5, right) fields of equivalent potential temperature. • Note the strong correlation between lower-fuselage radar (bottom left) and simulated reflectivity (see “a limited perspective,” MM5 reflectivity (dBZ) at 22:00 UTC 05 July). • Despite the small sample, it is worth noting observed melting ice (PIP imagery, stratiform region) with considerable IW mixing ratio at a mean flight-level temperature of 1.67 °C; ice is simply absent in the MM5 simulation at this level. • The statistics presented here reveal a unique temporal trend in simulated reflectivity, vertical velocity, and hydrometeor concentrations during the organizational stage of Dennis. • Narrower distributions of these parameters during the latter period of this stage suggest reduced ice microphysics processes. • In turn, ramifications on the simulated latent heat release are expected to hinder the MM5’s replication of Dennis’s observed intensification. • Furthermore, the MM5’s potentially evolving underestimation of convective activity may be extrapolated to an inability to accurately reflect latent heat of fusion in stratiform regions, thus impacting simulated intensification and rainfall. • To perform statistical analyses of observations from dropsondes, microphysical imaging probes, and coordinated NOAA P-3 and NASA ER-2 Doppler radars • To continue simulations of Dennis (including an extension to the mature stage, when Dennis was over the eastern Gulf of Mexico) • To pinpoint biases in the MM5 via a comparison of the temporal evolution of microphysics fields in the MM5 simulation (manifested in the statistical analyses presented here) with that of the prepared observational statistics • To evaluate the microphysical parameterization schemes with the intent to most accurately reproduce Dennis’s (and ultimately all tropical cyclones’) updrafts and downdrafts, hydrometeor production, conversion, fallout, and subsequent latent heat release at various lifecycle stages • To initiate the improvement of: • Microphysical parameterization schemes • Simulated spatial and temporal distributions of latent heat • Tropical cyclone intensity forecasts • Rainfall predictions In light of 1) the MM5’s deficiency in replicating the observed intensification of Dennis and 2) the localized differences in hydrometeor concentrations between the “early” and “late” period of the simulation, it is hypothesized that various temporal differences exist between simulated and observed distributions of microphysics fields during the organizational stage of Dennis. By highlighting the statistical differences in reflectivity, vertical velocity, and hydrometeor concentrations between the “early” and “late” stages of the simulation, a direct comparison with the evolution of observed microphysics fields can pinpoint biases in the MM5 mesoscale model. • A small percentage (> 0.10%) of large updrafts (i.e., isolated convective cores) between 18 m/s and 30 m/s exist during the “early” period; this localized, intense convection is virtually absent (< 0.01%) during the “late” period of the simulation. • The net effect of the tails of the broader vertical velocity distribution during the “early” period is to offset the magnitude of the mean vertical velocity profile, especially the mean magnitudes of updrafts. • Within convective regions (outlined in black on left), there appears to be, at least from the local perspective provided by cross sections, enhanced local reflectivity during the “early” period of the simulation. • This comparatively large reflectivity results from higher concentrations of rainwater and graupel mixing ratios during the “early” period. • Throughout the troposphere, reflectivity exhibits a broader distribution during the “early” than the “late” period of Dennis’s simulated organization. • As an example, compare the probability that reflectivity is > 40 dBZ at 11 km (histograms to right) during each of these two periods. • Despite approximate conformity of the MM5 simulated track of Dennis with the observed track (right), there is an approximate 20-hPa deficiency in the simulated intensification of Dennis over a 60-hour organizational period (left). An evaluation and comparison of microphysics fields in Dennis (2005) at various lifecycle stages SUMMARY MEAN PROFILE Eric C. Meyers Department of Earth Sciences, Millersville University, Millersville, PA Robert F. Rogers, Ph.D CONVECTIVE REGIONS GRAUPEL Hurricane Research Division, Atlantic Oceanographic and Meteorological Laboratory, Miami, FL HYPOTHESIS INITIAL COMPARISONS OBSERVATIONS SIMULATION 13 dropsondes derived equivalent potential temperature 20:38-22:30 UTC 05 July 2005 950 hPa MM5 derived equivalent potential temperature (K) 21:00 UTC 05 July 2005 950 hPa MOTIVATION CONTOURED FREQUENCY BY ALTITUDE DIAGRAMS (CFADs) - variation of probability density functions with height REFLECTIVITY CONVECTIVE REGIONS OBSERVATIONS mean T = 1.67 °C median T = 1.61 °C 01:58:49 - 02:01:23 UTC7 July 2005 bin size: 5 dBZ height: 11 km EARLY NOAA P-3 LF reflectivity 21:59 UTC 05 July 2005 650 hPa Compare with 22:00 UTC MM5 reflectivity under “a limited perspective” 18:00 UTC 05 July 2005 – 00:00 UTC 06 July 2005 Precipitation Imaging Probe 6.4 mm ICE bin size: 5 dBZ height: 11 km LATE 06:00 UTC 07 July 2005 – 12:00 UTC 07 July 2005 EARLY LATE CONCLUSIONS A LIMITED PERSPECTIVE VERTICAL VELOCITY MEAN PROFILE 700 hPa Cross Section MM5 reflectivity (dBZ) 22:00 UTC 05 July 2005 EARLY 18:00 UTC 05 July 2005 – 00:00 UTC 06 July 2005 0°C Graupel mixing ratio Rainwater mixing ratio bin size: 1 m/s LATE FUTURE WORK Cross Section MM5 reflectivity (dBZ) 09:00 UTC 07 July 2005 06:00 UTC 07 July 2005 – 12:00 UTC 07 July 2005 CONVECTIVE REGIONS bin size: 1 m/s