Download
1 / 20
220 likes | 400 Views
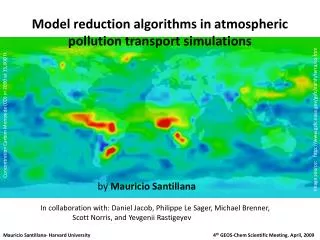
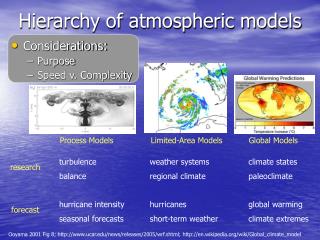
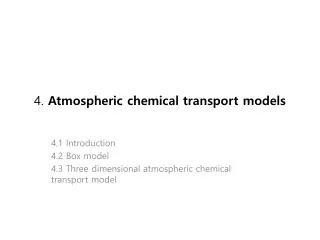
Atmospheric pollution models. Gross, A. Baklanov, U. S. Korsholm, J. H. Sørensen, A. Mahura & A. Rasmussen. Contents:. Air Pollution Modelling Description Results Population Exposure Modelling. 1. Workshop d. 6/2-7/2-2008. CEEH modelling framework: Model Components.

E N D
Atmospheric pollution models • Gross, A. Baklanov, U. S. Korsholm, • J. H. Sørensen, A. Mahura & A. Rasmussen Contents: • Air Pollution Modelling • Description • Results • Population Exposure Modelling 1. Workshop d. 6/2-7/2-2008
CEEH modelling framework: Model Components Meteorology / climate Ref.-year: 2000 EMEP, EDGAR, IPCC, etc. Population Air pollution, transport and deposition Emission modelling Health effects. Environmental impact and damage Energy systems Tech-nologies Energy system optimisation model(s) Externality cost functions Economic growth Scenarios for energy production 2010, 2020, 2030, 2040, 2050 Global externality cost for CO2
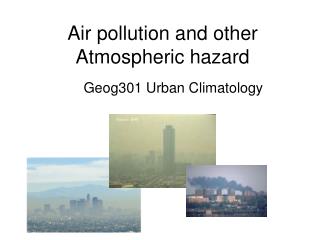
Thresholds of Air Pollutants . Red from the Danish Smog and ozoneberedskabet Green from EU
Air Quality Modeling Framework • Air Quality Monitoring Data • Chemical Initial Conditions • Lateral and Top Boundary Conditions Meteorological Observations Meteorological Forecast Model Meteorological Parameters Fields of Winds, Temperatures, Humidity and others Air Quality Forecast Time Resolved 3-Dimensional Fields of Air Pollutants and 2-Dimensional Deposition Patterns Air Quality Model or Subroutine Modules in Air Quality Model • Transport • 3-D advection • vertical diffusion • Cloud Effects • Aqueous chemistry • wet scavenging • vertical redistribution • Dry Deposition • Loss to surfaces by non-precipitation processes • Gas-Phase Chemistry • Integration of chemical rate equations for VOC, NOx, SO2 and ozone • Emissions • Determines emissions of VOC, NOx, SO2 and CO
Three Air Pollution Model Types Chemical Solvers Aerosol Module • Gas Phase • Aqueous phase • Chemical equil. • Climate Modeling • Approaches: • Normal distribution, • Bin approach • Physics: • Condensation • Evaporation • Emission • Nucleation • Deposition • Coagulation ECMWF DMI-HIRLAM Met. Models Eulerian trans- port 0.2-0.05 lat-lon, 25-40 vert. layer, 3-D regional scale Stochastic Lagrangian transport, 3-D regional scale Tropo. Trans. Models Emergency Pre- parednes & Risk Assess- ment. DERMA Off-Line Chemical Aerosol Trans. CAC On-Line Chemical Aerosol Trans. EnviroHIRLAM Regional (European) to city scale air pollution: smog and ozone. Nuclear, veterinary and chemical. Regional (European) to city scale air pollution: smog and ozone.
Off-Line modelling with CAC T:0.15º×0.15º • Currently nested versions of • HIRLAM 60 vertical layers: • T – 15x15 km2. • S – 5x5 km2. • Q – 5x5 km2. • U – 1.5x1.5 km2 of DK. S: 0.05º×0.05º A forecast integration starts out by assimilation of meteorological observations whereby a 3-d state of the atmosphere is produced, which as well as possible is in accordance with the observations. CAC Model Area • CAC 20x20 km2
CAC forecast, December 20, 2007 O3, NO, NO2, CO, SO2, Rn, Pb, PM2.5, PM10. Ozone NO2 X 1000 24 hour forecast 48 hour forecast ppbV 0 15 30 60 90 120 150
Ozone Modelling from August 8 to 12, 2003 Jægersborg Lille Valby Keldsnor Ulborg X: CAC forecasts X: observations
On-line air-quality modelling • I.e. models which includes feedbacks of chemistry and aerosol on NWP • At present only two meso-scale models with feedbacks exists (indirects effects of aerosols) • WRFChem (developed by NCAR) • EnviroHIRLAM (developed by DMI)
More details – Ulrik Korsholms presentation tomorrow Difference (ref – perturbation) in Accumulated dry deposition [ng/m2] Accumulated (reference) dry deposition [μg/m2] +48 h
Accidental fire in waste deposit Aalborg Portland 23 October 2005 DERMA calculations
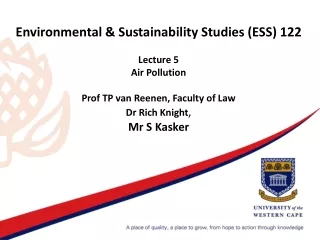
Population Exposure: Scheme of the suggested improvements of meteorological forecasts (NWP) in urban areas, interfaces to and integration with UAP and PE models
FUMAPEX target cities for improved UAQIFS implementation • #1 – Oslo, Norway • #2 – Turin, Italy • #3 – Helsinki, Finland • #4 – Valencia/Castellon, Spain • #5 – Bologna, Italy • #6 – Copenhagen, Denmark • Different ways of the UAQIFS implementation: • urban air quality forecasting mode, • urban management and planning mode, • public health assessment and exposure prediction mode, • urban emergency preparedness system.
Time activity of the population FUMAPEX: KTL Home location Workplaces
Population Exposure: inversion day At home FUMAPEX: KTL & FMI At other locations Exposure PM2.5 (μg/m3×persons)
GIS: Doses Individual and Collective Ignalina Nuclear Power Plant (Lithuania), Cs-137 .
Thank you for your attention! 1. Workshop d. 6/2-7/2-2008