Download
1 / 1
10 likes | 158 Views
A31C-0080. Aircraft- and Satellite-based Assessment of Relationships between CCN Concentration and Aerosol Optical Properties. Y. Shinozuka 1 ( Yohei.Shinozuka@nasa.gov ), J. Redemann 1 , P. B. Russell 2 , A. Nenes 3 , A. D. Clarke 4 , J. M. Livingston 5 , S . G. Howell 4

E N D
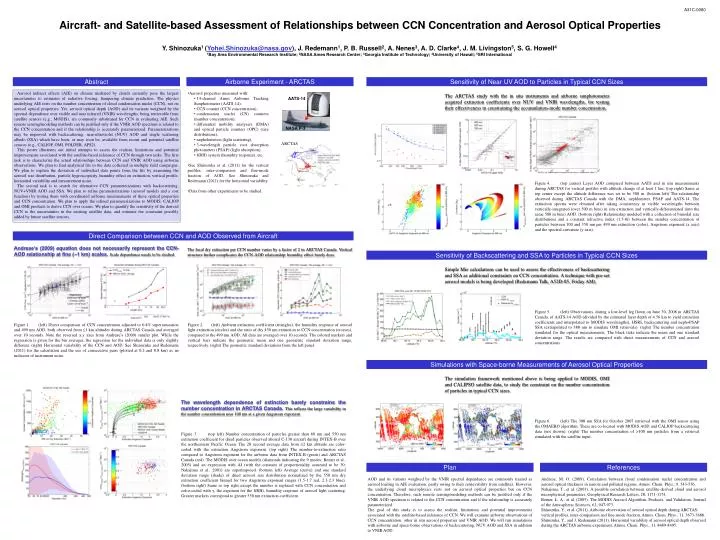
A31C-0080 Aircraft- and Satellite-based Assessment of Relationships between CCN Concentration and Aerosol Optical Properties Y. Shinozuka1 (Yohei.Shinozuka@nasa.gov), J. Redemann1, P. B. Russell2, A. Nenes3, A. D. Clarke4, J. M. Livingston5, S. G. Howell4 1Bay Area Environmental Research Institute; 2NASA Ames Research Center; 3Georgia Institute of Technology; 4University of Hawaii; 5SRI International Abstract Airborne Experiment - ARCTAS Sensitivity of Near UV AOD to Particles in Typical CCN Sizes Aerosol indirect effects (AIE) on climate mediated by clouds currently pose the largest uncertainties to estimates of radiative forcing, hampering climate prediction. The physics underlying AIE rests on the number concentration of cloud condensation nuclei (CCN), not on aerosol optical properties. Yet, aerosol optical depth (AOD) and its variants weighted by the spectral dependence over visible and near infrared (VNIR) wavelengths, being retrievable from satellite sensors (e.g., MODIS), are commonly substituted for CCN in evaluating AIE. Such remote sensing/modeling methods can be justified only if the VNIR AOD spectrum is related to the CCN concentration and if the relationship is accurately parameterized. Parameterizations may be improved with backscattering, near-ultraviolet (NUV) AOD and single scattering albedo (SSA) which have been, or may soon be, available from recent and potential satellite sensors (e.g., CALIOP, OMI, POLDER, APS2). This poster illustrates our initial attempts to assess the realism, limitations and potential improvements associated with the satellite-based inference of CCN through two tasks. The first task is to characterize the actual relationships between CCN and VNIR AOD using airborne observations. We plan to find analytical fits to the data collected in multiple field campaigns. We plan to explain the deviation of individual data points from the fits by examining the aerosol size distribution, particle hygroscopicity, humidity effect on extinction, vertical profile, horizontal variability and measurement noise. The second task is to search for alternative CCN parameterizations with backscattering, NUV+VNIR AOD and SSA. We plan to refine parameterizations (aerosol models and a cost function) by testing them with coordinated airborne measurements of these optical properties and CCN concentration. We plan to apply the refined parameterizations to MODIS, CALIOP and OMI products to derive CCN over oceans. We plan to quantify the sensitivity of the derived CCN to the uncertainties in the existing satellite data, and estimate the constraint possibly added by future satellite sensors. • Aerosol properties measured with: • 14-channel Ames Airborne Tracking Sunphotometer (AATS-14), • CCN counter (CCN concentration), • condensation nuclei (CN) counters (number concentration), • differential mobility analyzers (DMA) and optical particle counters (OPC) (size distributions), • nephelometers(light scattering), • 3-wavelength particle soot absorption photometers (PSAP) (light absorption), • f(RH) system (humidity response), etc. • See Shinozuka et al. (2011) for the vertical profiles, inter-comparison and fine-mode fraction of AOD. See Shinozuka and Redemann (2011) for the horizontal variability. • Data from other experiments to be studied. The ARCTAS study with the in situ instruments and airborne sunphotometeracquired extinction coefficients over NUV and VNIR wavelengths, for testing their effectiveness in constraining the accumulation-mode number concentration. AATS-14 NASA P-3 ARCTAS Figure 4.(top center) Layer AOD compared between AATS and in situ measurements during ARCTAS for vertical profiles with altitude change of at least 1 km. (top right) Same as top center except the altitude difference was set to be 500 m. (bottom left) The relationship observed during ARCTAS Canada with the DMA, nephlometer, PSAP and AATS-14. The extinction spectra were obtained after taking consistency in visible wavelengths between vertically-integrated (over 500 m bins) in situ extinction and vertically-differentiated (into the same 500 m bins) AOD. (bottom right) Relationship modeled with a collection of bimodal size distributions and a constant refractive index (1.5-0i) between the number concentration of particles between 100 and 350 nm per 499 nm extinction (color), Angstrom exponent (x axis) and the spectral curvature (y axis). Critical dry diameter, Ddc, derived from CCN measurement (Figure 2) and particle hygroscopicity(Figure 3) centers at 90 – 120 µm for 0.2% supersaturation, and shows an expected trend with the organic mass fraction. Direct Comparison between CCN and AOD Observed from Aircraft Andreae’s(2009) equation does not necessarily represent the CCN-AOD relationship at fine (~1 km) scales. Scale dependence needs to be studied. The local dry extinction per CCN number varies by a factor of 2 in ARCTAS Canada. Vertical structure further complicates the CCN-AOD relationship; humidity effect barely does. Sensitivity of Backscattering and SSA to Particles in Typical CCN Sizes Simple Mie calculations can be used to assess the effectiveness of backscattering and SSA as additional constraints on CCN concentration. A technique with pre-set aerosol models is being developed (Redemann Talk, A52D-05, Friday AM). Figure 5. (left) Observations, during a low-level leg flown on June 30, 2008 in ARCTAS Canada, of AATS-14 AOD (divided by the estimated layer depth of 4.56 km to yield extinction coefficients and interpolated to MODIS wavelengths), HSRL backscattering and neph+PSAP SSA (extrapolated to 388 nm to simulate OMI retrievals). (right) The number concentration simulated for the optical measurements. The black ticks indicate the mean and one standard deviation range. The results are compared with direct measurements of CCN and aerosol concentrations. Figure 1. (left) Direct comparison of CCN concentration adjusted to 0.4% supersaturation and 499 nm AOD, both observed from ≤1 km altitudes during ARCTAS Canada and averaged over 10 seconds. Note the reversed x,y axes from Andreae’s (2009) similar plot. While the regression is given for the bin averages, the regression for the individual data is only slightly different. (right) Horizontal variability of the CCN and AOD. See Shinozuka and Redemann (2011) for the calculation and the use of consecutive pairs (plotted at 0.2 and 0.8 km) as an indicator of instrument noise. Figure 2. (left) Ambient extinction coefficient (triangles), the humidity response of aerosol light extinction (circles) and the ratio of dry 450 nm extinction to CCN concentration (crosses), compared to the 499 nm AOD. All data are averaged over 10 seconds. The colored markers and vertical bars indicate the geometric mean and one geometric standard deviation range, respectively. (right) The geometric standard deviations from the left panel. Simulations with Space-borne Measurements of Aerosol Optical Properties The simulation framework mentioned above is being applied to MODIS, OMI and CALIPSO satellite data, to study the constraint on the number concentration of particles in typical CCN sizes. The wavelength dependence of extinction barely constrains the number concentration in ARCTAS Canada. This reflects the large variability in the number concentration near 100 nm at a given Angstrom exponent. Figure 6. (left) The 388 nm SSA for October 2007 retrieved with the OMI sensor using the OMAERO algorithm. These are co-located with MODIS AOD and CALIOP backscattering data (not shown). (right) The number concentration of >100 nm particles from a retrieval simulated with the satellite input. Figure 3. (top left) Number concentration of particles greater than 60 nm and 550 nm extinction coefficient for dried particles observed aboard C-130 aircraft during INTEX-B over the northeastern Pacific Ocean. The 20 second average data from ≤2 km altitude are color-coded with the extinction Angstrom exponent. (top right) The number-to-extinction ratio compared to Angstrom exponent for the airborne data from INTEX-B (green) and ARCTAS Canada (red). The MODIS over ocean models (diamonds indicating the 9 modes; Remer et al., 2005) and an expression with AI (with the constant of proportionality assumed to be 30; Nakajima et al., 2001) are superimposed. (bottom left) Average (curve) and one standard deviation range (shade) of dried aerosol size distribution normalized by the 550 nm dry extinction coefficient binned for two Angstrom exponent ranges (1.5-1.7 red, 2.1-2.3 blue). (bottom right) Same as top right except the number is replaced with CCN concentration and color-coded with γ, the exponent for the f(RH), humidity response of aerosol light scattering. Greater markers correspond to greater 550 nm extinction coefficient. Plan References AOD and its variants weighted by the VNIR spectral dependence are commonly treated as aerosol loading in AIE evaluation, partly owing to their retrievability from satellites. However, the underlying cloud microphysics rests not on aerosol optical properties but on CCN concentration. Therefore, such remote sensing/modeling methods can be justified only if the VNIR AOD spectrum is related to the CCN concentration and if the relationship is accurately parameterized. The goal of this study is to assess the realism, limitations and potential improvements associated with the satellite-based inference of CCN. We will examine airborne observations of CCN concentration, other in situ aerosol properties and VNIR AOD. We will run simulations with airborne and space-borne observations of backscattering, NUV AOD and SSA in addition to VNIR AOD. Andreae, M. O. (2009), Correlation between cloud condensation nuclei concentration and aerosol optical thickness in remote and polluted regions, Atmos. Chem. Phys., 9, 543-556. Nakajima, T., et al. (2001), A possible correlation between satellite-derived cloud and aerosol microphysical parameters, Geophysical Research Letters, 28, 1171-1174. Remer, L. A., et al. (2005), The MODIS Aerosol Algorithm, Products, and Validation, Journal of the Atmospheric Sciences, 62, 947-973. Shinozuka, Y., et al. (2011), Airborne observation of aerosol optical depth during ARCTAS: vertical profiles, inter-comparison and fine-mode fraction, Atmos. Chem. Phys., 11, 3673-3688. Shinozuka, Y., and J. Redemann (2011), Horizontal variability of aerosol optical depth observed during the ARCTAS airborne experiment, Atmos. Chem. Phys., 11, 8489-8495.