Download
1 / 5
50 likes | 203 Views
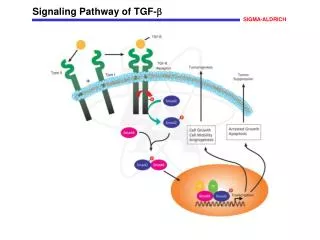
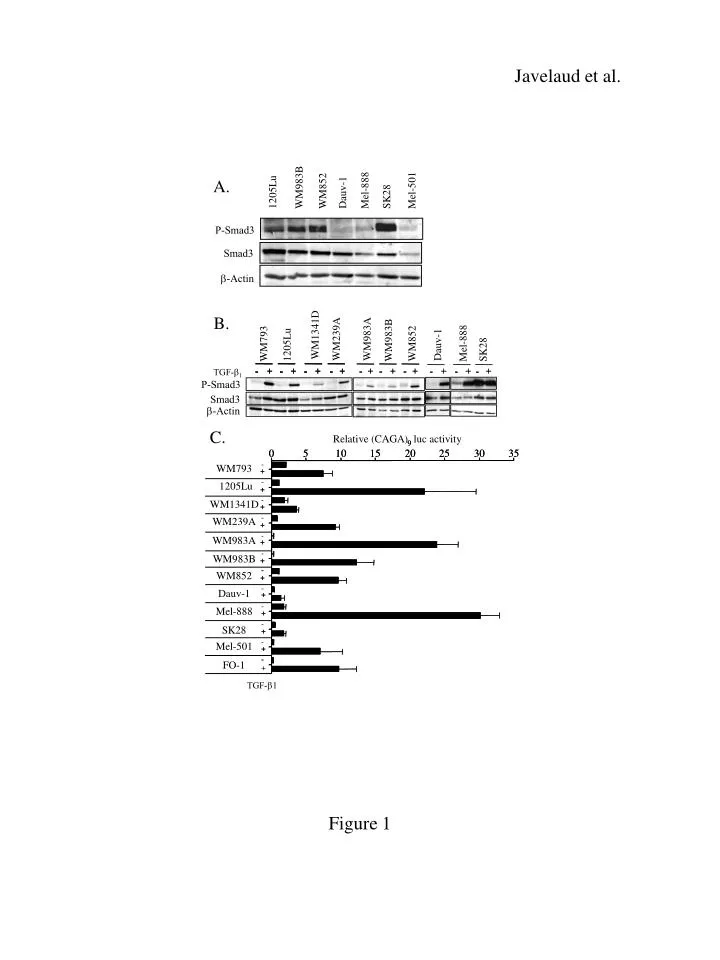
Javelaud et al. A. WM983B. Mel -888. Mel -501. WM852. 1205 L u. Dauv -1. SK 28. P-Smad3. Smad3. b -Actin. B. WM1341D. WM239A. WM983A. WM983B. Mel -888. WM852. WM793. Dauv -1. 1205 L u. SK 28. -. -. -. +. +. +. -. -. -. +. +. +. -. -. -. +. +. +. -. -. -.

E N D
Javelaud et al. A. WM983B Mel-888 Mel-501 WM852 1205Lu Dauv-1 SK28 P-Smad3 Smad3 b-Actin B. WM1341D WM239A WM983A WM983B Mel-888 WM852 WM793 Dauv-1 1205Lu SK28 - - - + + + - - - + + + - - - + + + - - - + + + - - + + - - + + - - + + - - - + + + - - - + + + - - - + + + TGF-b1 P-Smad3 Smad3 b-Actin C. Relative (CAGA) luc activity 9 9 0 0 5 5 10 10 15 15 20 20 25 25 30 30 35 35 - WM793 + + - 1205Lu + + - WM1341D + + - WM239A + + - WM983A + + - WM983B + + - - WM852 + + - Dauv-1 + + - Mel-888 + + - SK28 + + - Mel-501 + + - - FO-1 + TGF-b1 Figure 1
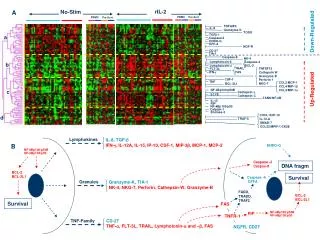
Javelaud et al. A. DMSO SB431542 DMSO SB431542 DMSO SB431542 5 4,5 4 3,5 3 Relative TGF-b1 expression 2,5 2 1,5 1 0,5 0 TGF-b1 - + - + - + - + - + - + 1205Lu WM983A WM983B B. DMSO SB431542 DMSO SB431542 14 12 Relative TGF-b2 expression 4 2 0 TGF-b1 - + - + + - + - 1205Lu WM852 D. C. Melanoma Supernatants w489 180 180 1205Lu Supernatant w489 w489 160 140 140 20’ 20’ 1h 2h 4h 8h 24h 24h 20’ 20’ 120 120 P-Smad3 100 100 Relative CAGA induction 80 80 Smad3 60 60 40 40 20 20 0 0 - - + + 1205Lu WM793 WM983A WM983B Figure 2
1205Lu S7.a S7.c 100 75 Survival (%) 50 25 0 0 50 100 150 200 Time (days) p<0.0001 *p<0.05 * * 4 1205Lu 3 Osteolytic Lesion Area (mm2) S7.c 2 S7.a 1 0 16 20 5 Average time of Death (Weeks) Javelaud et al. A B C D 5 4 Osteoltic Lesion Area (mm2) 3 2 1 0 0 1 2 3 4 5 6 7 Time (Weeks) Figure 3
Javelaud et al. B A Mock S7.a S7.c Mock S7.a S7.c 8 30 7 25 6 Reltative IL-11 expression 20 5 Relative PTHrP expression 15 4 3 10 2 5 1 0 0 TGF-b1 TGF-b1 - + - + - + - + - + - + C D Mock S7.a S7.c Mock S7.a S7.c 10 50 8 40 6 Relative OPN expression Relative CXCR4 expression 30 4 20 2 10 0 0 TGF-b1 TGF-b1 - + - + - + - + - + - + Figure 4
Javelaud et al. Mouse Bone Marrow MDA-MB-231 Soft tissue Bone - Mock S7 S7 Mock S7 hGAPDH hIL-11 hPTHrP hCTGF Figure 5