Download
1 / 29
290 likes | 431 Views
Leading Conversations about Student Goals and Outcomes. What Course-Taking Analysis Reveals. Student Success Conference October 2012. Understand what’s driving the focus on completion (defined as degree, certificate or transfer)

E N D
Leading Conversations about Student Goals and Outcomes What Course-Taking Analysis Reveals Student Success Conference October 2012
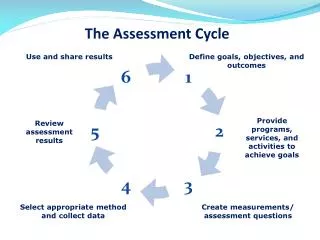
Understand what’s driving the focus on completion (defined as degree, certificate or transfer) Recognize how student course-taking behaviors relate to completion and success Become familiar with one approach to gathering non-completion data Session Outcomes Leading Conversations about Student Goals and Outcomes | October 2012
WHY THE FOCUS ON COMPLETION? The perfect storm of accountability and budget cuts Leading Conversations about Student Goals and Outcomes | October 2012
Factors Driving the Focus on Completion It’s a value-added world Major initiatives by the feds and foundations Legislative demands for return on investment Community demands for more equitable outcomes Lack of resources/systems to gather more nuanced measures Leading Conversations about Student Goals and Outcomes | October 2012
Student Success Task Force Recommendations & Act Avoided performance-based funding (for now) Placed an emphasis on completion through: • Setting enrollment priorities around pathways that lead to degrees, certificates and transfer • Prioritizing structures that encourage students onto a completion pathway (e.g., educational plans, programs of study, basic skills, and mandatory assessment) • Creating a public scorecard that will bring completion to the forefront Leading Conversations about Student Goals and Outcomes | October 2012
The Budget Crisis Pushing colleges to review data on what departments, programs and services to keep or cut • Some are pre-emptively following the Task Force direction • All colleges are getting public pressure to justify their resource allocation • Existing data primarily focuses on measures like completionand retention—most colleges don’t have other success measures available Leading Conversations about Student Goals and Outcomes | October 2012
What Gets Lost in the Completion Discussion? Not all of our students are seeking completion Our completion rates are not equitable • If we have to do more with less and completion is the measure, will our more vulnerable students be forced out? The journey to completion is a very long one • We need to understand what happens along the way to figure out where to focus our resources Leading Conversations about Student Goals and Outcomes | October 2012
Discussion Is your college more focused on completion as a result of the Task Force and the budget crisis? How is that affecting who gets priority at your college? How is it affecting the sections that you are offering ? Leading Conversations about Student Goals and Outcomes | October 2012
How else can we understand success? What student course-taking behaviors can tell us Leading Conversations about Student Goals and Outcomes | October 2012
Peter Bahr’s Cluster Analysis Tracked 165,921 first-timestudents who enrolled in at least one credit or noncredit community college course in fall 2001 Followed course-taking patterns over 7 years Did NOTuse factors such as students’ race/ ethnicity, status as a credit/noncredit student or stated goal Enables you to develop student profiles—it is not effective as a planning tool Leading Conversations about Student Goals and Outcomes | October 2012
Key Definitions Completion • Associate’s degree • Certificate • Transfer First Time Student • Had not previously attended college • Were not co-enrolled in high school or a four-year institution • Accounted for 70% of students who entered system in fall 2001 and attempted four-fifths of units in 2001-2002 Leading Conversations about Student Goals and Outcomes | October 2012
The Clusters Completion-Directed Pathways • Completion Likely (2 subgroups) • Completion Unlikely • CTE Non-Completion Pathways • Skills-Builders • Noncredit Leading Conversations about Student Goals and Outcomes | October 2012
Completion-Likely Continuum Students Most Likely to Complete • Enroll full time, stay about 6 years • Attempt an average of 123 credits in transferrable courses • Pass 73% of courses and have high completion rates (68%) Students Somewhat Likely to Complete • Enroll full time, stay about 4 years • Attempt 66 transferrable credits, but fewer math, physical & life sciences • Pass 73% of courses but have low completion rates (31%) Leading Conversations about Student Goals and Outcomes | October 2012
Our successful students take four to six years to complete and amass 65-125 units
Completion Directed Completion Unlikely • Enroll part time, attend intermittently, stay about 2 yrs • Attempt 16 transferrable credits, with more CTE • Pass 26% of courses and have very low completion rates (10%) Career Technical Education Students • Enroll full time, stay about 5 yrs • Attempt 82 units in commercial services, engineering and industrial technologies, health fields and public and protective services • Pass 80% of courses but have low completion rates (35%) Leading Conversations about Student Goals and Outcomes | October 2012
African American, Latino and Native American students are more likely to be in our less-successful clusters
Discussion Were you surprised that it takes so long for students to prepare for transfer or a degree, even when they enroll full-time? What have you seen on your own campus about time to completion? Given the high number of units attempted by transfer students, what impact could credit caps or a three-strikes policy have on this group? Leading Conversations about Student Goals and Outcomes | October 2012
Non-Completion Pathways Skills-Builder Students Take one course a year for two years, on average Attempt 7 credits in transferrable humanities and CTE, especially engineering and industrial technologies Pass 94% of courses but have very low completion rates (9%) Noncredit Students Enroll in about three courses a year for five years Take ESL, short-term vocational programs, health and safety education and programs for older adults Course completion data missing LeadigConversations about Student Goals and Outcomes | October 2012
Comparison of Pass and Completion Rates Among Clusters What’s Completion Got to Do with It? – April 2012
First-Time Student Types, Based on Head Count Statewide Averages-What’s Your Guess? Bahr found that averages varied by college Leading Conversations about Student Goals and Outcomes | October 2012
What About Those Non-Completers? A preliminary analysis of wage data found wage increases for skills-builder students. It also found that CTE students who did not complete a certificate or degree earned more money than CTE students who did complete. There are pathways through our colleges that we aren’t documenting or measuring. Leading Conversations about Student Goals and Outcomes | October 2012
Our current measures don’t capture job training and may erroneously treat a third of our students as failures
Discussion How will changes that your college is making to enrollment or course-scheduling likely affect skills-builder and noncredit students? How could colleges measure and document the success of skill-builder students and CTE students? Leading Conversations about Student Goals and Outcomes | October 2012
Discussion What other conclusions do you draw from this study? Leading Conversations about Student Goals and Outcomes | October 2012
From the state to the local Applying Bahr’s Findings to Cañada College Leading Conversations about Student Goals and Outcomes | October 2012
What can I do with this information? Making the connection for your college Leading Conversations about Student Goals and Outcomes | October 2012
Implementing Your Own Analysis Download a guide on the findings and instructions to replicate this study at www.rpgroup.org Access technical support from the RP Group on implementing the methodology Follow our next steps • Doing a detailed wage study (you can ask EDD for this too) • Recruiting colleges to do an analysis of specific course pathways for the clusters for a statewide report (later fall 2012) Leading Conversations about Student Goals and Outcomes | October 2012
Think, Pair, Share Pair up with someone else and discuss the following questions: What would it take to implement the course-taking analysis at your own college? How could you share the results of your own study or the statewide analysis with others? Leading Conversations about Student Goals and Outcomes | October 2012
Find Out More The RP Group Website www.rpgroup.org Terrence Willett, Course-taking Analysis twillett@rpgroup.org Kathy Booth, Statewide Success Conversations kbooth@rpgroup.org