Download

1 / 54
540 likes | 658 Views
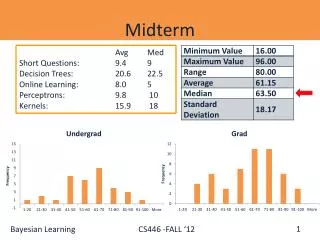
Midterm. Open “book” and notes; closed mouth 20-25 minutes to read carefully and answer completely 60 minutes to think 4 problems, with possible topics: Some debriefing on the role of MLMs Something on linear MLMs variances, etc. MLMs and shrinkage

E N D
Midterm • Open “book” and notes; closed mouth • 20-25 minutes to read carefully and answer completely • 60 minutes to think • 4 problems, with possible topics: • Some debriefing on the role of MLMs • Something on linear MLMs variances, etc. • MLMs and shrinkage • Some basic computations and interpretations of logit-linear models BIO656--Multilevel Models
PART 6 PROFILING, RANKING “League Tables” BIO656--Multilevel Models
RANKING IN THE NEWS BIO656--Multilevel Models
LETTERMAN’S TOP 10 LIST BIO656--Multilevel Models
NEW YORK’S MOST DEADLY CARDIAC SURGEONS!!!! BIO656--Multilevel Models
THE LEADING SPH IS HARVARD BIO656--Multilevel Models
HOPKINS IS THELEADING SPH!!! BIO656--Multilevel Models
PROFILING(League Tables) • The process of comparing “units” on an outcome measure with relative or normative standards • Quality of care, use of services, cost • Educational quality • Disease rates in small areas • Gene expression • Developing and implementing performance indices to compare physicians, hospitals, schools, teachers, genes, ........ BIO656--Multilevel Models
PROFILING OBJECTIVES(in health services) • Estimate and compare provider-specific performance measures: • Utilization/cost • Process measures • Clinical outcomes • Patient satisfaction/QoL • Compare using a normative (external) or a relative (internal) standard BIO656--Multilevel Models
RANKING IS EASY Just compute estimates & order them BIO656--Multilevel Models
MLE ESTIMATED SMRs BIO656--Multilevel Models
RANKING IS DIFFICULT Need to trade-off the estimates and uncertainties BIO656--Multilevel Models
MLE ESTIMATED SMRs & 95% CIs BIO656--Multilevel Models
Sampling variability &Systematic variability Systematic variability • Variability among physicians/hospitals that might be explained by hospital-specific characteristics Sampling variability • Statistical uncertainty of physician/hospital-specific performance measures Use MLMs that • Incorporate patient, physician and hospital-level characteristics • Capture all important uncertainties • Produce appropriate statistical summaries BIO656--Multilevel Models
Statistical Challenges Need a valid method of adjusting for case mix and other features • Patient, physician and hospital characteristics • But, beware of over adjustment Need a valid model for stochastic properties • Account for variation at all levels • Account for within-hospital, within-patient correlations Need to • Adjust for systematic variation • Estimate and account for statistical variation BIO656--Multilevel Models
PROPER USE OF STATISTICAL SUMMARIES The challenge • Differences in standard errors of hospital-specific estimates invalidate direct comparisons • In any case, large SEs make comparisons imprecise Consequence • Even after valid case mix adjustment, differences in directly estimated performance are due, in part, to sampling variability (Partial) Solution, use: • Shrinkage estimates to balance and reduce variability • Goal-specific estimates to hit the right target BIO656--Multilevel Models
Comparing performance measures Ranks/percentiles, of: • Direct estimates (MLEs) • Shrunken estimates (BLUPs, Posterior Means) • Z-scores testing H0 that a unit is just like others • Optimal (best) ranks or percentiles Other measures • Probability of a large difference between unit-specific “true” and H0-generated event rates • Probability of “excess mortality” • For the “typical patient, on average or for a specific patient type • Z-score/P-value declarations • .... BIO656--Multilevel Models
USRDS BIO656--Multilevel Models
USRDS BIO656--Multilevel Models
MLE ESTIMATED SMRs & CIs BIO656--Multilevel Models
Poisson-Normal Model(N, Y[k], emort[k]) are inputs model { {prec~dgamma(0.00001,0.00001) for (k in 1:N) { logsmr[k]~dnorm(0,prec) smr[k]<-exp(logsmr[k]) rate[k]<-emort[k]*smr[k] Y[k] ~ dpois(rate[k]) } } Monitor the SMR[k] BIO656--Multilevel Models
MLE, SE & POSTERIOR MEAN SMRs (using a log-normal/Poisson model) SE MLE PM BIO656--Multilevel Models
Posterior Mean: estimated SMRs & CIs using a log-normal/Poisson model (original scale) BIO656--Multilevel Models
Posterior Mean: estimated SMRs & CIs using a Gamma/Poisson model (expanded scale) BIO656--Multilevel Models
Caterpillar Plot (Hofer et al. JAMA 1999) • Estimated relative, physician-specific visit rate and 95% CI • Adjusted for patient demographic and case-mix • (1.0 is the “typical” rate) BIO656--Multilevel Models
Amount that physician-specific, laboratory costs for diabetic • patients deviates from the mean for all physicians [$/(pt. yr.)] • Lines show the path from the direct estimate (the MLE) to the • shrunken estimate (Hofer et al JAMA 1999) DIRECT ADJUSTED BIO656--Multilevel Models
Example using BUGS forhospital performance ranking BIO656--Multilevel Models
BUGS Model specification model { for k in 1:K { b[k]~dnorm(0, prec) r[k]~dbin(p[k], n[k]) logit(p[k]) <- mu + b[k] } pop.mean<-exp(mu + bb)/(1+exp(mu + bb)) mu~dnorm(0, 1E-6) prec~dgamma(.0001,.0001) tausq<-1/prec add~dnorm(0, prec) bb<- mu + add } Monitor the p[k] and ask for ranks BIO656--Multilevel Models
Summary Statistics BIO656--Multilevel Models
Posterior distributions of the ranks BIO656--Multilevel Models
LOS X = (Posterior Mean-Based Ranks) – (Optimal Ranks) = BIO656--Multilevel Models
LOS BIO656--Multilevel Models
Relations among percentiling methods 1998 USRDS Percentiles BIO656--Multilevel Models
BACK TO THE USRDS, SMR EXAMPLE BIO656--Multilevel Models
False detection and non-detection BIO656--Multilevel Models