Download
1 / 62
630 likes | 842 Views
“Closing The Achievement Gap for All Students”. Pat Davenport & Dr. Gerald E. Anderson. NO EXCUSES. Who’s To Blame?. The college professor said: “Such rawness in a student is a shame, lack of preparation in high school is to blame.”. Who’s To Blame?. Said the high school teacher:

E N D
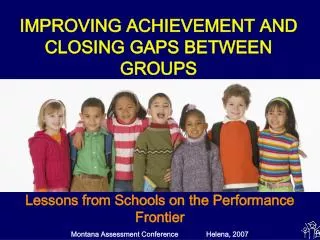
“Closing The Achievement Gap for All Students” Pat Davenport & Dr. Gerald E. Anderson
Who’s To Blame? The college professor said: “Such rawness in a student is a shame, lack of preparation in high school is to blame.”
Who’s To Blame? Said the high school teacher: “Good heavens! That boy’s a fool. The fault of course is with the middle school.”
Who’s To Blame? The middle school teacher said: “From stupidity may I be spared. They sent him in so unprepared.”
Who’s To Blame? The primary teacher huffed: “Kindergarten blockheads all. They call that preparation – why, it’s worse than none at all.”
Who’s To Blame? The kindergarten teacher said: “Such lack of training never did I see. What kind of woman must that mother be.”
Who’s To Blame? The mother said: “Poor helpless child. He’s not to blame. His father’s people were all the same.”
Who’s To Blame? Said the father at the end of the line: “I doubt the rascal’s even mine.” Anonymous
Building Blocks The Improvement Process is grounded in an integrated system of: • Effective Schools • Total Quality Management • PDCA Instructional Process
A Quality and Effective School District has... • A belief that they can teach all students • High expectations • A Vision • Leadership must focus the organization on the Vision • An aligned strategic planning process • An Plan-Do-Check-Act Instructional Process
Improvement Plan GOALS Random Acts Of Improvement = Programs
Student Achievement System Performance GOALS Aligned Acts Of Improvement In an aligned system ... … improvement efforts are integrated and results-oriented
The Power of Vision Vision without action is merely a dream; Action without vision just passes the time; Vision with action can change the world. - Joel Barker
If students are not literate, that is, they can not read, write, and do basic arithmetic: • 3 out of 4 will go on welfare. • 68% will commit a criminal offense. Source: National Adult Literacy Survey - 1993
Beliefs & Values Leadership must focus all members of the organization on our vision
Common Principles of Effective Schools & TQM • Proven Management Principles • Advances Organizational Aims & Goals • Data Driven • Continuous Improvement • Simple, not easy • Commitment, time & resources • Thinking “outside the Box”
1. Data Disaggregation 2. Timeline Development 3. Instructional Focus 4. Assessment 5. Tutorials 6. Enrichment The PDCA Eight-StepProcess 8. Monitoring 7. Maintenance
TAAS Velasco Elementary DEMOGRAPHICS: Economically Disadvantaged 86.9% African American 18.5% LEP 33.3% Hispanic 65.4% Mobility 17.8% White 15.8%
TAAS Velasco Elementary DEMOGRAPHICS: Economically Disadvantaged 86.9% African American 18.5% LEP 33.3% Hispanic 65.4% Mobility 17.8% White 15.8%
TAAS Velasco Elementary DEMOGRAPHICS: Economically Disadvantaged 86.9% African American 18.5% LEP 33.3% Hispanic 65.4% Mobility 17.8% White 15.8%
TAAS Freeport Intermediate DEMOGRAPHICS: Economically Disadvantaged 65.1% African American 12.6% LEP 4.4% Hispanic 48.5% Mobility 20.1% White 38.4%
TAAS Freeport Intermediate DEMOGRAPHICS: Economically Disadvantaged 65.1% African American 12.6% LEP 4.4% Hispanic 48.5% Mobility 20.1% White 38.4%
TAAS Freeport Intermediate DEMOGRAPHICS: Economically Disadvantaged 65.1% African American 12.6% LEP 4.4% Hispanic 48.5% Mobility 20.1% White 38.4%
TAAS Brazosport High School DEMOGRAPHICS: Economically Disadvantaged 70.0% African American 14.0% LEP 2.7% Hispanic 47.0% Mobility 23.4% White 38.4%
TAAS Brazosport High School DEMOGRAPHICS: Economically Disadvantaged 70.0% African American 14.0% LEP 2.7% Hispanic 47.0% Mobility 23.4% White 38.4%
TAAS Brazosport High School DEMOGRAPHICS: Economically Disadvantaged 70.0% African American 14.0% LEP 2.7% Hispanic 47.0% Mobility 23.4% White 38.4%
E.D. % All Students % % E.D. PASSING PASSING READING BEUTEL 14.0 100 100 BRANNEN 23.2 100 100 ROBERTS 27.1 96.6 98.0 NEY 31.0 95.6 97.4 POLK 47.0 97.7 97.8 AUSTIN 53.6 97.3 96.2 GRIFFITH 66.5 91.8 93.5 OGG 71.2 98.7 98.1 JANE LONG 75.8 94.3 94.3 FLEMING 84.2 90.1 90.5 VELASCO 86.9 93.2 94.6 Economically Disadvantaged Least to Greatest - Elementary
E.D. % All Students % % E.D. PASSING PASSING MATH BEUTEL 14.0 100 100 BRANNEN 23.2 93.5 98.1 ROBERTS 27.1 98.7 98.7 NEY 31.0 100 97.5 POLK 47.0 96.7 98.7 AUSTIN 53.6 98.7 99.4 GRIFFITH 66.5 93.7 94.1 OGG 71.2 98.6 99.1 JANE LONG 75.8 97.3 97.5 FLEMING 84.2 94.5 94.3 VELASCO 86.9 96.6 96.7 Economically Disadvantaged Least to Greatest - Elementary
E.D. % All Students % % E.D. PASSING PASSING WRITING BEUTEL 14.0 85.7 97.7 BRANNEN 23.2 100 100 ROBERTS 27.1 100 98.7 NEY 31.0 87.0 92.7 POLK 47.0 100 100 AUSTIN 53.6 95.7 95.6 GRIFFITH 66.5 90.5 91.3 OGG 71.2 100 100 JANE LONG 75.8 91.5 91.4 FLEMING 84.2 97.1 97.4 VELASCO 86.9 91.4 92.8 Economically Disadvantaged Least to Greatest - Elementary
E.D. % All Students % % E.D. PASSING PASSING READING LAKE JACKSON 16.3 91.4 97.8 CLUTE 43.4 92.6 93.6 FREEPORT 65.1 97.4 98.1 MATH LAKE JACKSON 16.3 98.3 98.6 CLUTE 43.4 99.6 99.0 FREEPORT 65.1 98.9 99.1 WRITING LAKE JACKSON 16.3 94.4 96.9 CLUTE 43.4 87.8 92.9 FREEPORT 65.1 95.7 96.9 Economically DisadvantagedLeast to Greatest - Intermediate
E.D. % All Students % % E.D. PASSING PASSING READING BRAZOSWOOD 14.4 94.7 98.3 BRAZOSPORT 70.1 94.6 97.1 MATH BRAZOSWOOD 14.4 93.8 98.3 BRAZOSPORT 70.1 99.1 99.1 WRITING BRAZOSWOOD 14.4 91.0 96.9 BRAZOSPORT 70.1 90.0 93.7 Economically DisadvantagedLeast to Greatest - High School
District 10-Year ComparisonsPercentage of BISD Students Passing Academic Excellence Indicator System Assessment Summed Across Grades 3-8 & 10
AEIS READING COMPARISON 98 97 94 94 92 82 70 64 60 57
AEIS MATH COMPARISON 98 97 97 96 92 79 70 58 55 54
AEIS WRITING COMPARISON 98 97 95 94 93 80 70 60 59 57
TAAS Special EducationStudents % Passing Grades 3-8 & 10
Focus on Achievement Three Focus on Achievement Schools