Download
1 / 14
140 likes | 147 Views
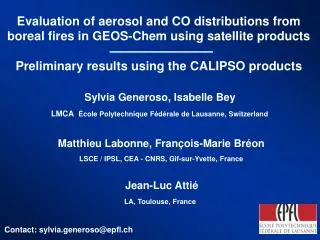
This study examines the interannual variability of methane concentrations from 1990 to 2004, analyzing the potential reasons for the observed trends. The model simulations consider various sources and sinks of methane, including anthropogenic emissions, wetlands, biomass burning, and stratospheric decay. The study also highlights the limitations and uncertainties in methane emissions and the impact of changing OH levels.

E N D
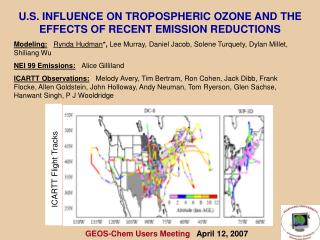
Evolution of methane concentrations for the period 1990-2004:Interannual variability in sinks and sources J. Drevet, I. Bey, J.O. Kaplan, S. Koumoutsaris, S. Generoso GEOS-Chem Meeting, 04-11-07 jerome.drevet@epfl.ch
Introduction ±5 ppb/year > 10 ppb /year ±0 ppb/year • Possible reasons: • Slow down in sources? • Increase of sinks? courtesy: E.J. Dlugokencky
Model version: v.07.02.04 Meteorological fields: GEOS-4 Resolution: 4x5° - 30 vertical levels (up to 0.01hPa) Emissions Anthropogenic: IIASA (Dentener et al. 2005), constant after 2000 Industry, Agriculture, Waste and waste water Wetland: scheme from Kaplan et al. (2002) Biomass Burning: derived from CO emissions of : Duncan et al.(2003) for 1987-1996 Generoso et al.(2003) for 1996-2005. Termites: Fung et al. (1991) Sink Stratospheric conditions: CH4 decay prescribed from a 2-D Stratospheric model. Tropospheric OH from a full-chemistry simulation, scaled by 0.8 (scaled OH – 9.92.105 molec/cm3) Model set up
Wetland scheme • Input data • Soil humidity • (GEOS) • Soil temperature • (GEOS) • Soil carbon content • (Lund-Potsdam-Jena Dynamic Global Vegetation model) • Wetland fraction • (derived from different data sources: Canadian Peatlands Database, US National Land Cover, etc…) Etrop Etemp « Tropical » emissions « Temperate » emissions Tr : factor of “tropicness” HR : Heterotrophic Respiration Wf: Wetland fraction Mf: Moisture factor Ef: Emission factor Kaplan et al. (2002)
Interannual variability in OH in different regions (1e4 molec. cm-3) Extra tropics NH Tropics NH Tropics SH Extra tropics SH Column (surface- 250 hPa) Surface- 750 hPa 750- 500 hPa 500- 250 hPa
Evaluation: Ground Measurements Alert (Canada) Mace Head (Irland) 1950 1900 1900 1850 [CH4] ppb 1850 [CH4] ppb 1800 1800 CMDL GEOS-Chem 1750 1750 92 94 96 98 00 02 04 92 94 96 98 00 02 04 Mahe Island (Seychelles) South Pole 1800 1800 1750 [CH4] ppb 1750 [CH4] ppb 1700 1700 1650 1650 92 94 96 98 00 02 04 92 94 96 98 00 02 04
CMDL GEOS-Chem Global trends 1850 Global mean CH4 concentrations 1800 [CH4] ppb 1750 1700 1990 1992 1994 1996 1998 2000 2002 2004 Global mean CH4 growth rate 10 ppb/year 5 0 1992 1994 1996 1998 2000 2002
Evaluation: CH4 total column GEOS-Chem X 0.975 1800 R2=0.75 1750 GEOS-Chem ppb 1640 1730 1820 Sciamachy retrievals 1700 1650 1650 1700 1750 1800 ppb Sciamachy retrievals Data from Frankenberg et al., 2005 ppb 1640 1730 1820
Sensitivity of the CH4 growth rate Standard simulation – simulation with constant OH Standard simulation – simulation with constant anthropogenic emissions Standard simulation – simulation with constant wetland emissions Standard simulation – simulation with constant biomass burning emissions ppb/year
Conclusion • Fairly good model-to-observations agreement for the first period of the study but significant deviation after 2000. • Long-term trend driven by OH and anthropogenic emissions. • Wetland emissions are important but not primary contribution to interannual CH4 variations. • Biomass burning emissions control peaks in growth rate. • Limitations of the present study: • Large uncertainties in methane emissions after 2000. • Trend in OH after 2000. • Variability in OH is largely driven by change in anthropogenic emissions. • However, NOx and CO emissions are constant after 1998 in the present simulation • But, in reality, Chinese NOx emissions increased by 71% between 1996 and 2005 and CO by 20% (D. Streets, pers. comm. 2007) • Would that change our trends in methane after 2000? Simulations are underway!
Evaluation: tropospheric profiles Central Canada ABLE3A July 1988 Eastern Brazil TRACE-A September 1992 China Sea PEM-WEST B February 1994 Hawaï TRACE-P April 2001 200 200 200 200 400 400 400 400 hPa 600 600 600 600 800 800 800 800 1000 1000 1000 1000 1.7 1.8 1.7 1.8 1.7 1.8 1.7 1.8 ppm ppm ppm ppm
Global trends CMDL GEOS-Chem CMDL GEOS-Chem 1850 Global mean CH4 concentrations 1800 ppb 1750 1700 1990 1992 1994 1996 1998 2000 2002 2004 Global mean CH4 growth rate 10 ppb/year 5 R=0.8 0 1992 1994 1996 1998 2000 2002
Budget Tropospheric burden Trop-Strat fluxes Tg/year Tg 90 92 94 96 98 00 02 04 90 92 94 96 98 00 02 04 Tropospheric decay Emissions Tg/year Tg/year 90 92 94 96 98 00 02 04 90 92 94 96 98 00 02 04