Download
1 / 28
280 likes | 503 Views
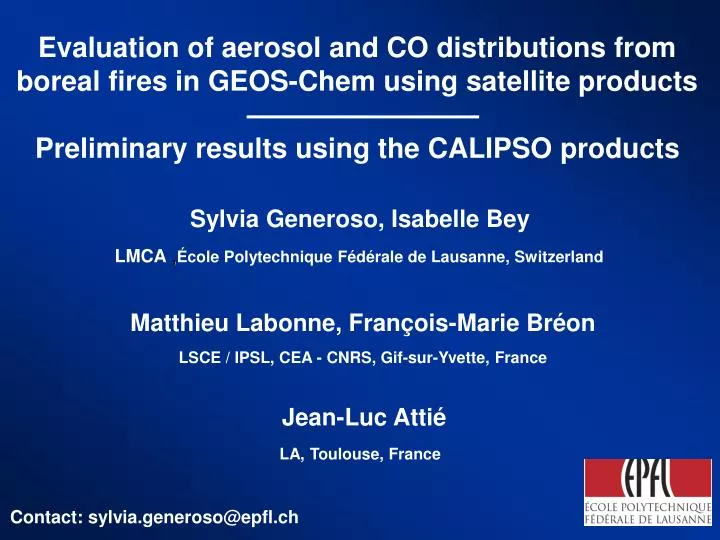
Evaluation of aerosol and CO distributions from boreal fires in GEOS-Chem using satellite products Preliminary results using the CALIPSO products. Sylvia Generoso, Isabelle Bey. LMCA , É cole Polytechnique Fédérale de Lausanne, Switzerland. Matthieu Labonne, François-Marie Bréon.

E N D
Evaluation of aerosol and CO distributions from boreal fires in GEOS-Chem using satellite products Preliminary results using the CALIPSO products Sylvia Generoso, Isabelle Bey LMCA ,École Polytechnique Fédérale de Lausanne, Switzerland Matthieu Labonne, François-Marie Bréon LSCE / IPSL, CEA - CNRS, Gif-sur-Yvette, France Jean-Luc Attié LA, Toulouse, France Contact: sylvia.generoso@epfl.ch
NASA / MODIS May 2003 Model and satellite observations used GEOS-Chem version v07-02-03 - resolution 2°x2.5°, 30 vertical levels, 50 tracers, GEOS-4 meteorological fields - biomass burning emissions for 2003 : interannual and seasonal variations based on AATSR fire counts [Generoso et al, 2003] - AOT of the fine mode (AOTfine) including carbonaceous aerosols, sulfates and sea salt - CO columns applying MOPITT averaging kernel Aerosol satellite products - POLDER AOTfine_865 (r<0.5 µm) Polarization and Directionality of the Earth Reflectance aboard ADEOS Data in 1996/1997, 2003 PARASOL (similar sensor) currently flying on PARASOL (A train) - MODIS AOTfine_550 (r<0.5 µm) CO satellite products - MOPITT
Spring and summer 2003 in Russia (May-June-July-August 2003 seasonal mean) POLDER MODIS MOPITT R : 0.65 B:-10±66% R : 0.72 B:-29±61% R : 0.78 B:-9±9%
Simulations conducted Standard simulation: from July 2002, and analyzed from May to August 2003 Russian fire sources Biomass Burning Emission Injection Height (EIH) Deposition processes Sensitivity simulations: from April 2003, and analyzed from May to August 2003 • Results show : • aerosol distributions : highly sensitive to daily resolution of BB emission inventories and to injection above the PBL in the late fire season (July and August) • CO distributions : sensitive to injection above the PBL in the late fire season (July and August) • Biomass Burning source strenght : underestimate of our emissions in May 2003
•MOPITT CO column ∆GEOS-Chem BE ∆GEOS-Chem Standard •POLDER AOTfine_865 ∆GEOS-Chem BE ∆GEOS-Chem Standard •MODIS AOTfine_550 ∆GEOS-Chem BE ∆GEOS-Chem Standard Daily results averaged over the North Pacific • Set-up for the “Best Estimate” (BE) simulation • Fire emissions are • increased by a factor 3 in May • prescribed on a daily-basis • Injected up to 4.5 km in July and August
Ratio between the Best Estimate (BE) and a simulation with the Russian fire sources turned off (woBB) Contribution of the 2003 Russian fires to the Northern Hemisphere AOT BC deposition
Contribution of the 2003 Russian fires to the “Arctic Haze” events Number of days (during MJJA 03) for which the AOT550> 0.094 = threshold to define Arctic haze events [Herber et al, J. Geophys. Res., 2002] Contribution of the 2003 Russian fires to the AOT during the days of Arctic Haze events
Ratio between the Best Estimate (BE) and the standard (STD) simulations AOT BC deposition
Preliminary evaluation of the aerosol vertical distribution in GEOS-Chem using CALIPSO lidar products
The CALIPSO mission Cloud-Aerosol Lidar and Infrared Pathfinder Satellite Observation Quick overview - CALIPSO is a joint U.S. (NASA) and French (Centre National d’Etudes Spatiales/CNES) satellite mission with an expected 3 years lifetime. - Launched on April 28, 2006 aboard CloudSat satellite - Data available since mid-June 2006 - Part of the A-train constellation - Includes 3 instruments, which measure aerosol and cloud properties : Cloud-Aerosol Lidar with Orthogonal Polarization (CALIOP) Imaging Infrared Radiometer (IIR) Wide Field Camera (WFC) In this study We use CALIOP attenuated backscatter at 550 nm (Level 1 products)
CALIOP measures attenuated backscatter : - giving information on the vertical structure of the atmosphere - including information from aerosols and clouds - depending on the extinction and the phase function
GEOS-Chem attenuated backscatter calculated : • from the AOT : include aerosol information only • - with an estimated fixed phase function : only qualitative comparisons possible so far • (GEOS-Chem version v07-03-06)
July 1, 2006 CALIOP GEOS-Chem
July 2, 2006 CALIOP GEOS-Chem
July 3, 2006 CALIOP GEOS-Chem
July 4, 2006 CALIOP GEOS-Chem
July 5, 2006 CALIOP GEOS-Chem
July 6, 2006 CALIOP GEOS-Chem
Conclusions • - In the standard configuration, the model significantly underestimates the MOPITT CO columns, POLDER and MODIS AOT over the north Pacific during May to August 2003. • - Increasing the amount of the biomass burning emissions does not necessarily result in significant improvements (except in May). • - In contrast, the use of daily biomass burningemission inventories improved significantly the aerosol simulations, without any significant effect on the CO columns. • The injection of particles up to 4.5 km also impacts our simulation but only in the late fire season (July and August). • - According to our improved simulation, the 2003 Russian fires contribute to 16-33% to the monthly mean AOT averaged north of 75°N and to 40-56% to the mass of BC deposited. They contribute to more than 30% of the AOT during the days of Arctic haze events in spring and summer. • - Very encouraging preliminary results from the comparisons between GEOS-Chem and CALIOP data !
Surface CO simulated by the BE compared to measurements (CMDL) months ppbv
level n 50% n-1 25% n-2 12.5% n-3 6.25% ... 1 % remaining grid cell Injection Mode David Lavoué, personnal communication
Monthly versus daily ATSR-derived biomass burning emission inventories
ATSR fire count and emission inventories Definition of “homogeneous” regions An emission constant computed as the ratio between : 1/ an initial emission estimate (climatology) 2/ATSR fire count averaged over the region and a long observation period (1999-2004) The emission constant is applied to the monthly ATSR fire count ATSR fire counts for 2000 Available from July 96 to Oct 06 The seasonal cycle, inter-annual variations and spatial distributions are based on satellite observations Generoso et al, ACP, 2003
ATSR versus other satellite products ATSR AVHRR TRMM GLOBSCAR GBA2000 Although all products do have uncertainties, the ATSR night time restriction does not appear to be significant and show a seasonal cycle that is consistent with the other proxies. Generoso et al, ACP, 2003
POLDER (Polarization and Directionality of the Earth Reflectance) (aboard ADEOS) POLDER-1 : Nov 96 to Jun 97 POLDER-2 : Apr 03 to Oct 03 (local over pass time ~ 10:30 am) Total AOT (Aerosol Optical Thickness) (over ocean only) Fine mode AOT (over ocean and land) Retrieved from polarized light Retrieved from reflectance May2003