Download
1 / 1
10 likes | 218 Views
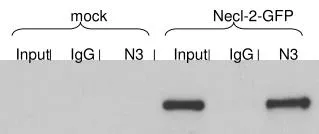
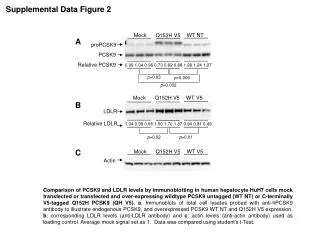
Supplemental Data Figure 2. Mock. WT NT. Q152H V5. A. proPCSK9. PCSK9. Relative PCSK9 0.99 1.04 0.96 0.73 0.82 0.88 1.28 1.24 1.27. p =0.03. p =0.006. p =0.002. Mock. WT V5. Q152H V5. B. LDLR. Relative LDLR 1.04 0.99 0.96 1.50 1.70 1.37 0.94 0.81 0.49. p =0.02. p =0.01.

E N D
Supplemental Data Figure 2 Mock WT NT Q152H V5 A proPCSK9 PCSK9 Relative PCSK9 0.99 1.04 0.96 0.73 0.82 0.88 1.28 1.24 1.27 p=0.03 p=0.006 p=0.002 Mock WT V5 Q152H V5 B LDLR Relative LDLR 1.04 0.99 0.96 1.50 1.70 1.37 0.94 0.81 0.49 p=0.02 p=0.01 C Mock WT V5 Q152H V5 Actin Comparison of PCSK9 and LDLR levels by immunoblotting in human hepatocyte HuH7 cells mock transfected or transfected and over-expressing wildtype PCSK9 untagged (WT NT) or C-terminally V5-tagged Q152H PCSK9 (QH V5).a; Immunoblots of total cell lysates probed with anti-hPCSK9 antibody to illustrate endogenous PCSK9, and overexpressed PCSK9 WT NT and Q152H V5 expression. b; corresponding LDLR levels (anti-LDLR antibody) and c; actin levels (anti-actin antibody) used as loading control. Average mock signal set as 1. Data was compared using student’s t-Test.