Download
1 / 28
280 likes | 413 Views
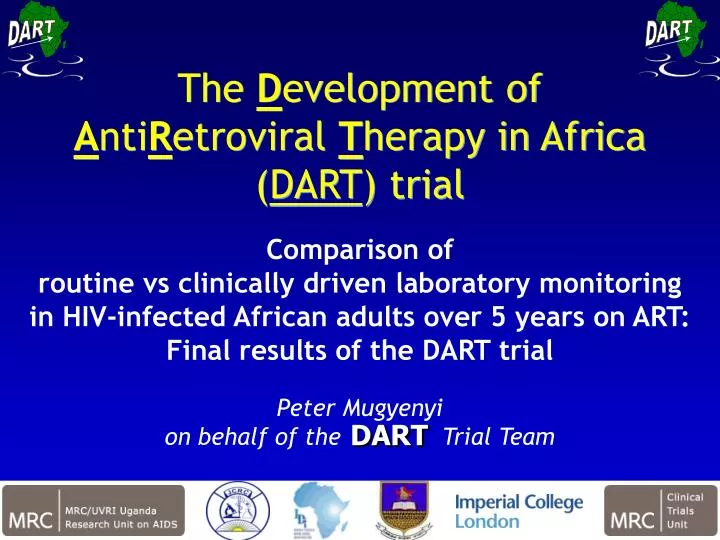
Peter Mugyenyi on behalf of the Trial Team. DART. The D evelopment of A nti R etroviral T herapy in Africa ( DART ) trial. Comparison of routine vs clinically driven laboratory monitoring in HIV-infected African adults over 5 years on ART: Final results of the DART trial.

E N D
Peter Mugyenyi on behalf of the Trial Team DART The Development of AntiRetroviral Therapy in Africa(DART) trial Comparison of routine vs clinically driven laboratory monitoring in HIV-infected African adults over 5 years on ART:Final results of the DART trial
Main objective of DART • To evaluate the need for routine laboratory monitoring of ART • in African adults who fulfilled clinical and CD4 criteria for ART initiation • in terms of clinical effectiveness, safety and costs • Primary endpoints • Efficacy: new WHO stage 4 HIV event (AIDS) or death • Safety: any Serious Adverse Event which is not only HIV-related
Trial design 3316 ART-naive adults with stage WHO 2, 3 or 4 HIV disease, CD4<200 cells/mm3 initiating triple drug ART randomise • Laboratory and ClinicalMonitoring (LCM) • 12 weekly biochemistry,FBC & CD4 • Other investigations & concomitant medications if clinically indicated • Switch to second-line for • new/recurrent WHO 4 (or multiple WHO 3) • CD4<100 cells/mm3 Clinically Driven Monitoring (CDM) 12 weekly biochemistry,FBC & CD4;FBC & biochemistry only returned if clinically indicated (or grade 4 toxicity); CD4 never returned Other investigations & concomitant medications if clinically indicated Switch to second-line for new/recurrent WHO 4 (ormultiple WHO 3) As per WHO guidelines, switching before 48 weeks discouraged in both arms
Trial status • 6578 patients screened • 3316 patients randomised to CDM or LCM • between 15 January 2003 and 28 October 2004 • Final data to 31 December 2008 (max 6, median 4.9 years) • during Jan 2009, all laboratory tests returned to CDM participants • participants transitioned care into Ugandan and Zimbabwean national ART programmes (except those in second-line studies) • results of second-line studies expected early 2010
Characteristics at baseline(ART initiation) * assayed in a subset (N=968) at baseline only
Follow-up • Median follow-up to 31 December 2008 4.9 years (IQR 4.5-5.3) • 14,937 person-years • 236 (7%) lost to follow-up • 98% and 99% of expected nurse and doctor visits attended • high patient-reported adherence Blinding of laboratory test results in the CDM arm • Few CDM participants sought external CD4 counts • clinicians remained blinded • at DART exit, 81/1281 (6%) reported having CD4s done privately • 43/81 had 1 CD4 test only • 3/81 had 6 or more
LCM CDM Adverse events 1.0 SAE p=0.20 0.8 ART- modifying AE p=0.85 0.6 Grade 4 AE p=0.18 Proportion event-free 0.4 Grade 3/4 AE p=0.52 0.2 0.0 0 1 2 3 4 5 Years from randomisation (ART initiation)
Switch to second-line 0.5 HR(CDM:LCM) = 0.84 (95% CI 0.72-0.98), p=0.03 0.4 Proportion switched to second-line (cumulative incidence) 0.3 LCM CDM 0.2 0.1 0.0 0 1 2 3 4 5 Years from randomisation (ART initiation) HR(CDM:LCM) 0.48 0.77 0.90 1.35 1.10 heterogeneity p=0.001
Progression to new WHO 4 event or death(primary endpoint) 1.0 0.88 0.88 0.82 0.79 356 events LCM: 5.2/100 PY 0.78 0.72 0.8 CDM: 6.9/100 PY 459 events 0.6 Proportion alive without a new WHO 4 event 0.4 0.2 0.0 0 1 2 3 4 5 Years from randomisation (ART initiation) LCM: n= 1656 1438 1364 1306 1255 682 CDM: n= 1660 1443 1354 1262 1184 613
Progression to new WHO 4 event or death(primary endpoint) 1.0 0.88 0.88 0.82 0.79 356 events LCM: 5.2/100 PY 0.78 0.72 0.8 CDM: 6.9/100 PY 459 events 0.6 Proportion alive without a new WHO 4 event 0.4 0.2 HR(CDM:LCM) = 1.31 (95% CI 1.14-1.51) p=0.0001 0.0 0 1 2 3 4 5 Years from randomisation (ART initiation) LCM: n= 1656 1438 1364 1306 1255 682 CDM: n= 1660 1443 1354 1262 1184 613
Survival 0.95 0.94 0.92 0.90 164 events LCM: 2.2/100 PY 0.90 0.87 1.0 CDM: 2.9/100 PY 218 events 0.8 0.6 Proportion alive 0.4 0.2 HR(CDM:LCM) = 1.35 (1.10-1.65) p=0.004 Number needed to monitor for 1 year to prevent 1 event =130 0.0 0 1 2 3 4 5 Years from randomisation (ART initiation) LCM 1656 1552 1501 1468 1436 796 CDM 1660 1542 1494 1445 1395 749
Survival 0.55 0.18 0.08 1.0 0.8 0.6 Proportion alive 0.4 Entebbe Cohort(Uganda): pre-ART 1996-2000, median CD4 75 at enrolment: 57.7/100 PY 0.2 0.0 0 1 2 3 4 5 Years from enrolment
Survival 0.94 0.55 0.90 0.18 0.87 0.08 1.0 CDM: 2.9/100 PY 218 events 0.8 0.6 Proportion alive 0.4 Entebbe Cohort(Uganda): pre-ART 1996-2000, median CD4 75 at enrolment: 57.7/100 PY 0.2 0.0 0 1 2 3 4 5 Years from enrolment
Survival 0.95 0.94 0.55 0.92 0.90 0.18 164 events LCM: 2.2/100 PY 0.90 0.87 0.08 1.0 CDM: 2.9/100 PY 218 events 0.8 0.6 Proportion alive 0.4 Entebbe Cohort(Uganda): pre-ART 1996-2000, median CD4 75 at enrolment: 57.7/100 PY 0.2 0.0 0 1 2 3 4 5 Years from enrolment
Death LCM 0-<2 years CDM 0-<2 years New WHO 4/death (PRIMARY) Absolute event rates over time on ART predicted rate of new WHO4/death in LCM 0 2 4 6 8 10 12 Rate per 100 PY (95% CI)
Death LCM 0-<2 years CDM 0-<2 years New WHO 4/death (PRIMARY) LCM 2-6 years CDM 2-6 years Absolute event rates over time on ART predicted rate of new WHO4/death in LCM 0 2 4 6 8 10 12 Rate per 100 PY (95% CI)
Death LCM 0-<2 years CDM 0-<2 years New WHO 4/death (PRIMARY) LCM 2-6 years CDM 2-6 years New severe WHO 4/death EXCLUDING oesophageal candidiasis Absolute event rates over time on ART predicted rate of new WHO4/death in LCM 0 2 4 6 8 10 12 Rate per 100 PY (95% CI)
Main Finding • There is a small but statistically significant difference in mortality and disease progression between the two arms only from the third year on ART • What causes this?
Explanation • There is a small but statistically significant difference in mortality and disease progression between the two arms only from the third year on ART • What causes this? • Slightly later switching to second-line therapy in CDM leading to a few more patients in CDM living with lower CD4 counts on first-line and at increased risk of clinical events
LCM CDM Most recent CD4 on first-line Median 372338 800 700 600 75%70% 500 Last CD4 (cells/mm3) 400 300 250 200 100 1%3% 1% 4% 50 0 last seen alive on first-line
LCM CDM Most recent CD4 on first-line Median 372338 800 700 600 75%70% 500 Last CD4 (cells/mm3) 400 300 250 200 100 1%3% 1% 4% 50 0 last seen alive on first-line
LCM CDM Most recent CD4 on first-line Median372 33810060 800 700 600 75% 70%19%9% 500 Last CD4 (cells/mm3) 400 300 250 200 100 1% 3%18%20% 1% 4%32% 46% 50 0 LCM CDM last seen alive on first-line died on first-line
LCM CDM Most recent CD4 on first-line Median372 33810060 800 700 600 75% 70%19%9% 500 Last CD4 (cells/mm3) 400 300 250 200 100 1% 3%18%20% 1% 4%32% 46% 50 0 LCM CDM last seen alive on first-line died on first-line
Most recent CD4 on first-line or at switch Median372 338 100 606356 800 700 600 75% 70% 19% 9%2%20% 500 Last CD4 (cells/mm3) 400 300 250 200 100 1% 3% 18% 20%38%16% 1% 4% 32% 46%40% 48% 50 0 LCM CDM LCM CDM LCM CDM last seen alive on first-line died on first-line switched tosecond-line
Most recent CD4 on first-line or at switch Median372 338 100 606356 800 700 600 75% 70% 19% 9%2%20% 500 Last CD4 (cells/mm3) 400 300 250 200 100 1% 3% 18% 20%38%16% 1% 4% 32% 46%40% 48% 50 0 LCM CDM LCM CDM LCM CDM last seen alive on first-line died on first-line switched tosecond-line
Absolute change in CD4 over 5 years 450 LCM 400 CDM 350 300 Mean absolute CD4 (cells/mm3) (pointwise 95% CI) 250 200 150 global p=0.02 100 0 72 84 12 24 36 60 96 48 108 120 132 156 168 180 192 252 276 288 216 228 240 144 204 264 Weeks from randomisation (ART initiation) NB: some participants were on STIs at weeks 60, 84 and 108
Conclusions • 5-year survival in 3316 participants with advanced HIV disease pre-ART was excellent (CDM 87%,LCM 90%) • Loss to follow-up was very low • Routine laboratory monitoring for toxicity did not impact adverse events or substitutions in first-line • 12-weekly CD4 monitoring had no impact on disease progression during the first 2 years on ART • after 2 years, a small but significant impact on clinical disease progression favouring LCM appeared to be driven by later switch to second-line ART in CDM • there may be a role for targeted, as opposed to routine, CD4 monitoring from the second year on ART