Download
1 / 19
190 likes | 333 Views
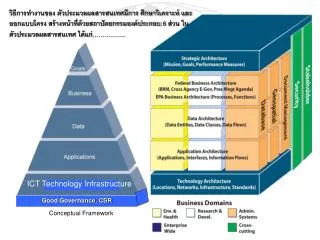
Conceptual Framework for Evaluating the Impact of Inactive Wells on Public Water Supply (PWS) Wells. Rick Johnson Oregon Health & Science University. Inactive Well. PWS Well. Aquitard. Downward vertical gradients are often created near PWS wells in confined aquifers

E N D
Conceptual Framework for Evaluating the Impact of Inactive Wells on Public Water Supply (PWS) Wells Rick Johnson Oregon Health & Science University
Inactive Well PWS Well Aquitard • Downward vertical gradients are often created near PWS wells in confined aquifers • Many inactive (e.g., irrigation) wells are screened across aquitards • Under these conditions the inactive wells will leak water to the confined aquifer
Numerical Model of Inactive Well Impacts Inactive Well PWS Well Unconfined Aquifer 100 m Confined Aquifer 3000 m 8000 m Aquitard=10 m thick
Key Definition: 10-Year Capture Zone Area (CZA) PWS Well 3000 m 10-year capture zone 8000 m
) 16 2 14 12 10 High 10-Year Capture Zone Area (km 8 6 Medium 4 2 Low 0 0 1.5 3 4.5 Pumping Rate (mgd)
0.20 Low 0.16 0.12 High Fraction of PWS Well Flow 0.08 0.04 0.00 0 500 1000 1500 2000 Distance from PWS Well Contribution of water to PWS from inactive well significant!
Why is the inactive well contribution “constant” for different pumping rates? One reason is that vertical gradient increases as pumping increases 0.16 High 0.14 0.12 0.1 Vertical Hydraulic Gradient 0.08 0.06 0.04 Low 0.02 0 0 500 1000 1500 2000 Distance from PWS Well (m)
CONCLUSIONS FOR A SINGLE PWS WELL • Flow through even a single inactive well can be a significant fraction of the total flow through a PWS well • The contribution of the inactive well to total flow is roughly constant • The contribution of the inactive well does not depend strongly on the location of the inactive well within the capture zone of the PWS well.
3000 m PWS Well 8000 m To examine the effect of multiple wells, we can use the simplified case of a continuously-operating PWS well surrounded by 8 seasonally-inactive irrigation wells • PWS well flow = 1.5 mgd • Irrigation wells on a 1-km grid each pumping at 0.75 mgd for 6 months of each year
Assume wintertime recharge • Assume summertime recharge from irrigation in 1 km2 area surrounding each well 10-year capture zone area 3000 m Summertime recharge due to irrigation 8000 m
As with the single well case, the inactive well has a significant impact on total PWS Well flow 0.2 0.15 Fraction of PWS Well Flow 0.1 0.05 0 0 500 1000 1500 2000 Distance from PWS Well (m)
1.00 0.80 0.60 in Confined Aquifer Fraction of Leaked Mass Retained 0.40 0.20 0.00 0 500 1000 1500 2000 Distance from PWS Well (m) How much water leaked into the confined aquifer is pumped out by irrigation wells? Almost None!
0.2 0.15 Coming from Confined Aquifer 0.1 Fraction of Irrigation Water 0.05 0 0 500 1000 1500 2000 Distance from PWS Well (m) Why does so much mass remain in the confined aquifer? Because most of the irrigation water comes from the unsaturated aquifer
10 8 6 Volume Leaked/ Volume Pumped from Confined Aquifer 4 2 0 0 500 1000 1500 2000 Distance from PWS Well (m) Another way of looking at this is that the volume of water leaked to the confined aquifer is 2-6 times greater than volume pumped from the confined aquifer.
CONCLUSIONS FOR A PWS WELL AND MULTIPLE SEASONALLY-INACTIVE IRRIGATION WELLS • The 10-year CZA is reduced somewhat by the irrigation wells • The fraction of the total PWS well flow coming from a single irrigation well is still significant. • The fraction does not vary much with distance from the CWS well • Nearly all of the water leaking into the confined aquifer during inactive periods remains in the confined aquifer.
Next Steps: • To put the magnitude of the inactive well problem in perspective: • We need to better understand the density of inactive wells in the vicinity of PWS wells • The kind of detailed well-distribution data shown for the York case is being examined at other locations by NAWQA
Next Steps (cont): • 2. We need to better understand the probability that inactive wells are delivering contaminants to the confined aquifer and the PWS well. • Water quality data at the PWS and from monitoring wells is helping to determine this • Environmental tracers from the PWS can be used to estimate the potential impact of inactive wells