Download
1 / 13
130 likes | 225 Views
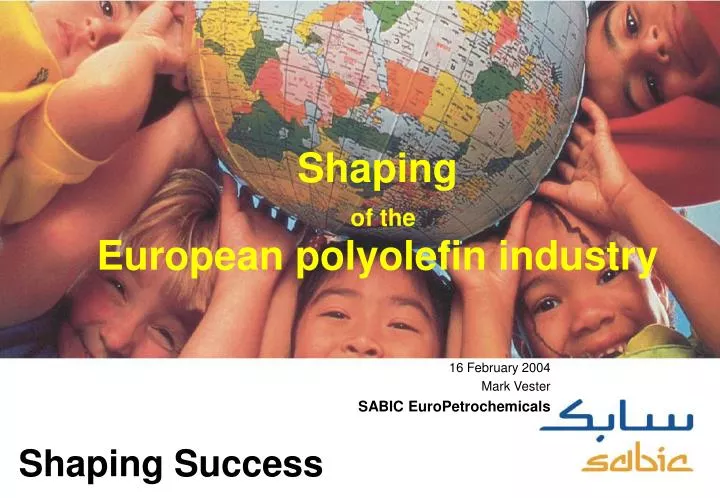
Shaping of the European polyolefin industry. 16 February 2004 Mark Vester SABIC EuroPetrochemicals. Shaping Success. Contents. Business Outlook Major factors affecting Europe How will Europe shape for success?. Gap between WE and ME at historical peak!. Circles represent

E N D
Shaping of theEuropean polyolefin industry 16 February 2004 Mark Vester SABIC EuroPetrochemicals Shaping Success
Contents • Business Outlook • Major factors affecting Europe • How will Europe shape for success?
Gap between WE and ME at historical peak! Circles represent typical ranges ME producer WE producer Delivered cost to WE customer (Eur/t) structural delta in cost LOW HIGH LOW HIGH Gas price ($/mmBTU) Oil price ($/bbl) • Oil and naphtha pricing has shifted upward • European cost increase, impact on pricing levels
New price range will break psychological barrier • Oil and Naphtha determine WE integrated cost position • OPEC seems determined to keep prices at today’s level • At recent historical margin levels (below re-investment level) • Historical rangePresent range • Oil ($/bll) 15 - 25 25 - 35 • average PE (Eur/t) 500 - 1000 700 - 1200 • WE marginal cost producers supply most of the market • Cost levels today require 900 - 1000 Eur/t PE for integrated business to survive • Price levels will fluctuate between 700 and 1200 Euro/t
Prices set records, will margins follow? Annual increase (kt) • Until 2001capacity addition in WE was significant • Coming years demand looks healthy, capacity additions are limited
ME share of global capacity increases Share of global capacity (%) • ME capacity build-up in HD/LL continues • For LDPE build-up is now taking off • Technology portfolio in ME is broadening, e.g. LDPE, bimodal HDPE • Gap in cost between ME and WE is at historical peak
Imports take lion share of market growth Volume (Kt) • Imports increase in coming years: ME and CEE capacity • PE imports into WE claim 20% market share by 2008 (13% today) • ME share of imports raise towards 75% (50% today) • Exports remain at today’s level
Europe N. Am. Asia ME S. Am. ME and Asia determine the global game Americas and Europe increasingly local for local ME can supply to Asia and Europe (and lands at lowest cost) ME balances structural positions over Asia and Europe
PE Delivered Cost and Price curve Oil and naphtha euro/t WE cost Middle East HDPE leader imports Delivered cost Price Cumulative volume Growth will come from ME • Cost curve changes shape • Price levels dictated by European cost level and ME/Asia global balancing
PE Delivered Cost and Price curve Oil and naphtha euro/t WE cost Middle East HDPE leader imports Delivered cost Price Cumulative volume What do we need to do ? Globally 91 producers < 500 kt (25% of capacity) 94 sites < 200 kt (42% of capacity) Source Maack Business Services • Producers • WE scrap and selectively build • Focus on key competences and markets • Grow from ME • Converters • Anticipate increased price levels • Reshuffle supplier base • Team up with leading suppliers
Integration and logistics are important • More than 20 out of 50 sites in WE have no grid connection • 30% of WE ethylene capacity • 75% of ethylene is used captive • Average WE PE producer is active from 6 sites • Average WE PE capacity per site is only 270 kt • ARG well positioned to supply Europe • ARG supplies 40% of WE ethylene and PE demand • ARG area exports 2,5 mln ton PE to non ARG countries • 80% ARG capacity is captive • Average ARG PE capacity per site is 450 kt • 7 out of WE European top 10 sites (scale and integration) are at ARG
Conclusions • Scrap rigorously and build selectively in Europe • tremendous amount of scrap potential • cost leaders annually beat inflation • Growth from lowest cost platform (import) • Price levels will shift • Producers focus on key competences • select markets / products • Converters anticipate • team up with leading suppliers
W.E. M.E. Converter Supplier … and have fun !! Shaping success