Download
1 / 23
230 likes | 409 Views
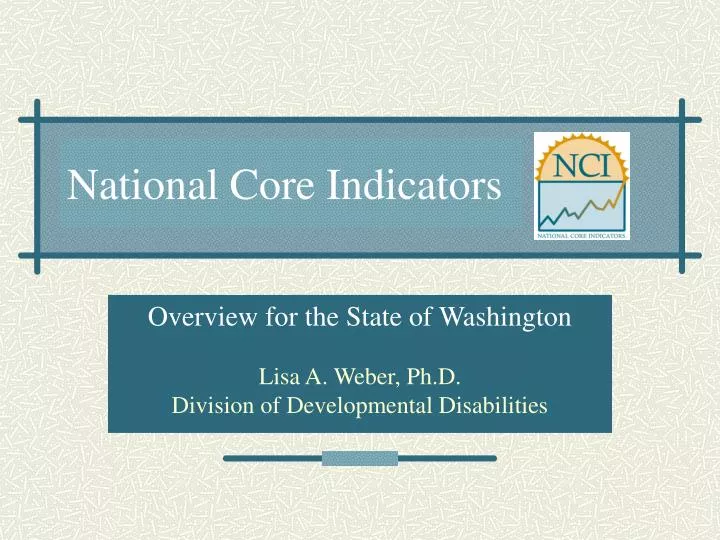
National Core Indicators. Overview for the State of Washington Lisa A. Weber, Ph.D. Division of Developmental Disabilities. What has NCI Accomplished?. Nationally recognized set of performance and outcome indicators for developmental disabilities service systems

E N D
National Core Indicators Overview for the State of Washington Lisa A. Weber, Ph.D. Division of Developmental Disabilities
What has NCI Accomplished? • Nationally recognized set of performance and outcome indicators for developmental disabilities service systems • Reliable data collection methods & tools (consumer & family surveys, provider survey, system data) • Baselineand trend data at the state & national level
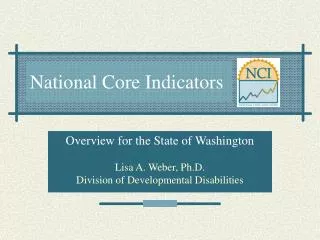
Participating NCI States NH ME WA VT ND AK ND MT MA MN OR NY WI SD RI ID MI CT WY PA NJ IA OH DE NE NV IN IL DC WV UT VA MD CO CA MO KS KY NC HI TN SC OK AR AZ NM Orange County MS GA AL LA TX FL PR
NCI Structure • Currently 21 states plus Orange County • Human Services Research Institute (HSRI) provides technical assistance under subcontract to the National Assoc. of State Directors of Developmental Disabilities Services (NASDDDS) • Subcommittees address specific issues • Meet with full steering committee annually • Funded primarily through state participation fees • WA State has used the UW Center for Disability Policy & Research (CDPR) to collect consumer and family data.
Where does NCI fit in? • A major component of our state’s Quality Assurance Plan • Primary method for obtaining comprehensive and statistically reliable feedback from our providers and a representative sample of the persons we serve • Cross-State comparison data • Monitor system impacts as we implement service system changes
What are the data sources? • Consumer Survey • Family Survey • Adult Family Survey (at home, 18+) • Family Guardian Survey (out-of-home) • Children Family Survey (at home, <18) • Provider Survey • Staff Stability • Board Representation • System Data • Incidents • Mortality
What are the Core Indicators? • Consumer Outcomes: • Employment (earnings, hours worked) • Community Inclusion • Choice and Decision-making (personal choices, support-related choices) • Self-determination (new) • Relationships • Satisfaction (with home and job)
What are the Core Indicators? • System Performance • Service Coordination • Family and Individual Participation (on boards of directors) • Utilization (types of services provided) • Financial Level of Effort • Cultural Competence (access to supports) • Access (relative to population)
What are the Core Indicators? • Health, Welfare, and Rights • Safety (mortality, injuries, crimes) • Health (routine exams) • Medications • Wellness (new) • Restraints • Respect/Rights
What are the Core Indicators? • Staff Stability and Competence • Staff Stability (turnover and vacancy rates, length of employment) • Staff Competence (new)
What are the Core Indicators? • Family Indicators • Information and Planning • Choice & Control • Access & Support Delivery • Community Connections • Family Involvement • Satisfaction • Family Outcomes
NCI in Washington State • Participation since Phase II (2000) • Even phases – Consumer Interviews (except Phase VI), Adult Family Survey, Family/Guardian Survey • Odd phases – Child/Family Survey • Every year – Provider Survey, System Data
Additional Indicators in WA • Case Management/Service Coordination • Individual Providers • Self-Determination • Residential and Employment/Day Program Provider Wage/Benefits
What do we do with the data? • Results shared with DDD management, external stakeholders and advisory groups • A group of DDD employees, including both headquarters and regional staff reviews the results in detail and has put together a series of recommendations for the division director • Developmental Disabilities Council (DDC) will do a three-year project to gather groups of people who are the subject of the reports and ask them to make recommendations to the division.
How is NCI data used? • Setting goals and strategic planning (e.g., management performance agreements, regionally set goals, quality improvement plans) • Budget requests to Governor and legislators (e.g., to illustrate our need for more case managers and service funding, to support requests for provider rate increases) • Helps shape data reporting systems (e.g., incidents, mortality)
National Core Indicators Selected Results
Consumers & Families –Areas of Strength • Satisfaction with Services Received • 92% of consumers are satisfied with where they live • 94% of consumers are satisfied with their work/day program • Courtesy & Respect • 94% report that most day support staff treat them with respect • 93% report that most residential support staff treat them with respect • 92% of families report that DDD staff are generally respectful and courteous
Consumers & Families --Potential Areas for Improvement • Case Management • Only 49% of consumers report that their case manager asks them what’s important • 65% of families providing care for the consumer can contact their case manager whenever they want to • Access to Services • 47% of families get the services and supports they need • 28% of consumers report that needed services were not available
Next steps… • Complete a baseline report with recommendations. • Review internal workgroup and DDC recommendations • Develop an action plan and implement selected recommendations • Monitor effect of service system changes during future data collection phases
For More Information • Reports with cross-state comparison data are available on HSRI’s website: www.hsri.org • Results for additional indicators added locally can be viewed from reports on the CDPR website at depts.washington.edu/cdpr • WA State Updates (select Projects) www1.dshs.wa.gov/ddd • Contact: weberla@dshs.wa.gov