Download
1 / 24
240 likes | 244 Views
This presentation explores the peculiar spectral and polarization emissions of solar flare productive active regions and their potential diagnostics. It discusses observations made with the solar dedicated telescope RATAN-600 in the 2-16 GHz frequency range, as well as the development of web applications for automatic diagnostics.

E N D
Solar active regions with peculiar spectral polarization emission and its possible diagnostics V.M. Bogod, T.I. Kaltman, Special astrophysical observatory, RussiaL.V. Yasnov.St.Petersburg State University, Russia
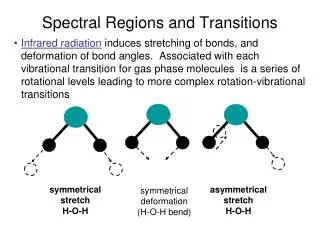
Last years the various unusual spectra of solar flare productive active regions were discovered by radio telescope RATAN-600 in 2 – 16 GHz frequency range.
1. RATAN-600 as a solar dedicated telescope South sector of the RATAN-600 in combination with the Flat mirror forms a Kraus-type periscope system. Combined with the receiver complex it provides unique possibilities for solar radio research: • high flux sensitivity (~Jy) • High accuracy of polarization degree measurements (0.02%) • broad frequency range (2-18 GHz) • high spectral resolution (1% ) Limitations: • Low temporal resolution (4 hours coverage near 7-11 UT with 4 min interval ) • 1D imaging (17 arcsec x 20 arcmin at 16.4 GHz) feed Secondary mirror antenna Receivers
Pre-flare diagnostic Statistical study revealed an existence of special features of flare-productive active regions (Bogod and Tokhchukova, 2003, 2006). The regular and broadband RATAN-600 observations are convenient for the daily analysis and diagnostic of the pre-flare plasma. Now the web applications for the such automatic diagnostic are under development. V. M. Bogod and S.Kh.Tokhchukova, Astronomy Letters, 2003, 29,4,p.263. V. M. Bogod and S.Kh.Tokhchukova, Cosmic Research, 2006, 44,6,p.506.
Features of the preflare plasma spectra in the range 2.0 сm –5.0 сm observed with RATAN-600 • I. Short-wave polarization emission brightening • II. Polarization inversion at short centimeter waves • III. Appearing of the low polarization band in frequency spectrum • IV. Multiple inversions of polarization sign • V. Darkening effect several hours before the flare • VI. Polarization flux variations in broad frequency band before and after a big flare
In this presentation we consider the flare productive active regions spectra with a sufficient depression of polarized emission (Stokes parameter V) at 6 -12 GHz̶ in the middle of registered frequency range 2 -16 GHz , up to inversion of polarization sign.
2. Observations of solar regions with RATAN-600 (2 – 16 GHz) AR 9077, 2000, Jule, 10
AR 10570 2004.03.05 2004.03.06 2004.03.07
3. Model of hot loop The coronal loops are an inherent part of active regions and play an important role in processes occurring in these regions and resulting in solar flares. The hot loop radiation can markedly influence on the active region properties in cm-dm range. Research of specific spectral and polarizational features of microwave emission from coronal magnetic loops is an available way to retrieve physical conditions in coronal magnetic loops.
Coronal loops usually connect opposite polarities of magnetic field. We consider 3D-model of the coronal magnetic loop as a hot half-torus. For our simulations we have chosen a simple form of magnetic field with magnetic force lines as semicircles (similar to Zlotnik et al. 2007a, 2007b; Brosius and Holman,1987). This form of magnetic field lines coincides with the levels of equal magnetic field, determining gyroresonance layers, where the cyclotron radiation at a given frequency emerges. R0 – radius of the loop, B0 – magnetic field at the loop axis
Kinetic temperature is assumed to be enhanced in torus along magnetic field line: hch = 2.0×108 cm hc = 3.0×108 cm Tch = 104 K Tc = 106 K
The electron density decreases with the height according to barometric law from an initial value:
It is necessary to note that we do not contemplate to construct a model of the physically realistic coronal loop which would be able to provide the observed properties of a certain radio source. Our purpose is to consider a possible influence of coronal loop on the observed properties and to explain some specific sources of centimeter and decimeter radiation from active regions.
According to well known relations for optical depth and brightness temperature for thermal cyclotron radiation (Zheleznyakov,1970, Zlotnik,1968) we calculate emission spectra of ordinary and extraordinary radiation from the modeled source. We take into account the dependence of optical thickness of gyroresonance layers on plasma temperature and electron density, as well as on the angle between magnetic field and the line-of-sight.
Model calculations 300-500 G 10 GHz - 700 G. y=0.2×10⁹, N0=2×10¹¹см-3.
5. Influence of magnetic field distribution on calculated TV and TI spectra. Takakura, T.: 1972, Solar Phys. 26, 151 y=0, R0=9×108cm, a=1×108cm,B0=500 G
a magnetic field strength of the hot loop a product of the relative magnetic field gradient by the loop thickness
6. Conclusions • The unusual spectra of solar flare productive active regions were discovered by radio telescope RATAN-600 in 2 – 16 GHz frequency range with a sufficient depression (at 6-12 GHz) of polarized emission (Stokes parameter V). • Some simple models of hot loop (as a torus and as a dipole approximation) were used for calculations of frequency structure of microwave source emission with mentioned peculiarities. • These simulations have confirmed the possible interpretation of these polarization peculiarities by a presence of hot loops in the solar corona. • The observed parameters of polarization emission allow to estimate a magnetic field strength of the hot loop B0=360-450 Gs and a product of the relative magnetic field gradient by the loop thickness 0.26 до 0.63.
These characteristics are not strongly affected by magnetic field model due to small thickness of loop; • In frames of torus model these characteristics are not nether affected by limited space resolution of RATAN-600 as the measured spectra are approximately equals at different positions along the active region. BUT: • For more complicated magnetic field configurations the integral characteristics of hot loop radio emission can be rather different in comparison to torus hot loop model.