Download
1 / 14
160 likes | 343 Views
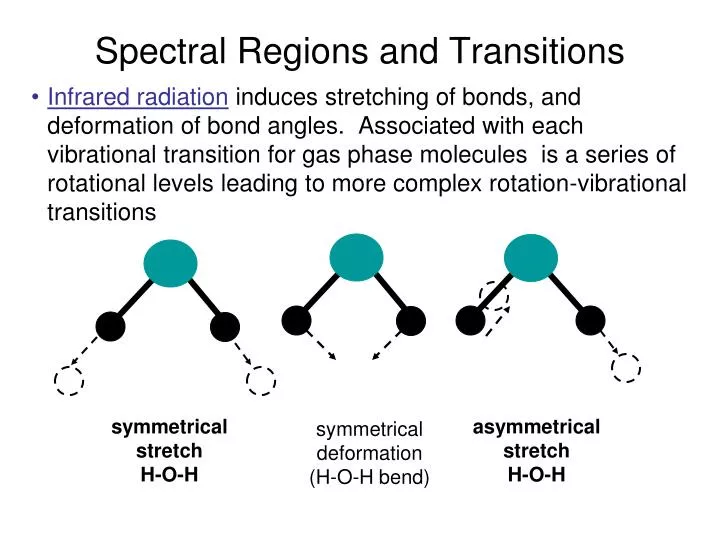
Spectral Regions and Transitions. Infrared radiation induces stretching of bonds, and deformation of bond angles. Associated with each vibrational transition for gas phase molecules is a series of rotational levels leading to more complex rotation-vibrational transitions. symmetrical stretch

E N D
Spectral Regions and Transitions • Infrared radiation induces stretching of bonds, and deformation of bond angles. Associated with each vibrational transition for gas phase molecules is a series of rotational levels leading to more complex rotation-vibrational transitions symmetrical stretch H-O-H asymmetrical stretch H-O-H symmetrical deformation (H-O-H bend)
Vibrational States and Transitions • The simplest case is a diatomic molecule. Rotations (2) and translations (3) leave only one vibrational degree of freedom, the bond length change, Dr, a one dimensional harmonic oscillator • One can solve this problem exactly as a classical Hook’s law problem with • a restoring force: F = –kDr and • potential energy: V=1/2 k(Dr)2 • Quantum mechanically: Ev = (v+1/2)hn , • n is the vibration frequency
Harmonic Oscillator Model for vibrational spectroscopy (virtual state) E Raman 9 2 hn v = 4 7 2 hn v = 3 5 2 v = 2 hn 3 2 v = 1 hn hn 1 2 hn Ev = (v+½)hn Dv = 1 DE = hn n = (1/2p)(k/m)½ IR v = 0 re re r re q
Vibrational States and Transitions for the simplest harmonic oscillator case (diatomic): n = (1/2p)(k/µ)1/2where k is the force constant (d2V/dq2). • In practice, stronger bonds have sharper (more curvature) potential energy curves, result: higher k, and higher frequency. and µ is the reduced mass [m1m2 / (m1+m2)]. • In practice, heavier atom moving, have lower frequency. vibrational frequencies reflect structure, bonds and atoms
Vibrational States and Transitions • Summary: high mass ==> low frequency strong bond ==> high frequency • Some simple examples (stretches in polyatomics): -C-C- ~1000 cm-1 C-H ~2800 cm-1 -C=C- ~1600 cm-1 C-D ~2200 cm-1 -C C- ~2200 cm-1 C---N ~1300 cm-1
Polyatomic Vibrational States • For a molecule of N atoms, there are (3N-6) vibrational degrees of freedom. This complex problem can be solved the harmonic approximation by transforming to a new set of normal coordinates (combinations of internal coordinates, qi) to simplify the potential energy V—method unimportant for this course V =V0+ S (dV/dqi)0qi + (½) S (d2V/dqiqj)0qiqj + . . . . . • This results in a molecular energy that is just the sum of the individual vibrational energies of each normal mode: E = S Ei = S (vi + ½) hni • As a result we have characteristic IR and Raman frequencies, ni, which are reflect bond types in the molecule. The frequency pattern forms a “fingerprint” for the molecule and its structure. • Variations due to conformation and environment give structural insight and are the prime tools for Protein IR and Raman.
Dipole Moment • Interaction of light with matter can be described as the induction of dipoles, mind , by the light electric field, E: • mind= a.E where a is the polarizability • IR absorption strength is proportional to • A ~ |<Yf |m| Yi>|2,transition moment between YiYf • To be observed in the IR, the molecule must change its electric dipole moment, µ , in the transition—leads to selection rules dµ / dQi 0 • Raman intensity is related to the polarizability, • I ~ <Yb |a| Ya>2, similarlyda / dQi 0for Raman observation
IR vs. Raman Selection Rules • At its core, Raman also depends on dipolar interaction, but it is a two-photon process, excite with n0 and detect ns, where nvib = n0 - ns, so there are two m’s. <Y0|m| Yi> • <Yi|m| Yn> ~ a => need a change in POLARIZABILITY for Raman effect Raman IR i n0 ns n n 0 0 nvib = nn-n0 = DE / h nvib = n0-ns
Symmetry Selection Rules (Dipole, etc.) Example: symmetric stretch O=C=O infrared inactive dm/dQ = 0 Raman Intense da/dQ 0 asymmetric stretch O=C=O infrared active dm/dQ 0 bending O=C=O infrared active dm/dQ 0
Complementarity: IR and Raman IR Raman If molecule is centrosymmetric, no overlap of IR and Raman
Vibrational Transition Selection Rules Harmonic oscillator: only one quantum can change on each excitation D vi = ± 1,D vj = 0; i j . These are fundamental vibrations Anharmonicity permits overtones and combinations Normally transitions will be seen from only vi = 0, since most excited states have little population. Population, ni, is determined by thermal equilibrium, from the Boltzman relationship: ni = n0 exp[-(Ei-E0)/kT], where T is the temperature (ºK) – (note: kT at room temp ~200 cm-1)
Anharmonic Transitions E/De D0 DE01 = hnanh ( r - re )/re Real molecules are anharmonic to some degree so other transitions do occur but are weak. These are termed overtones (D vi = ± 2,± 3, . .) or combination bands (D vi = ± 1, D vj = ± 1, . .). Biological systems we generally overlook this, most important in C-H stretch region
Beer-Lambert Law: A = lc A = Absorbance = Absorptivity l = Pathlength c = Concentration Peak Heights An overlay of 5 spectra of Isopropanol (IPA) in water. IPA Conc. varies from 70% to 9%. Note how the absorbance changes with concentration. • The size (intensity) of absorbance bands depend upon molecular concentration and sample thickness (pathlength) • The Absorptivity () is a measure of a molecule’s absorbance at a given wavenumber normalized to correct for concentration and pathlength – but as shown can be concentration dependent if molecules interact
Peak Widths Water Water • Peak Width is Molecule Dependent • Strong Molecular Interactions = Broad Bands • Weak Molecular Interactions = Narrow Bands Benzene