Download

1 / 55
550 likes | 561 Views
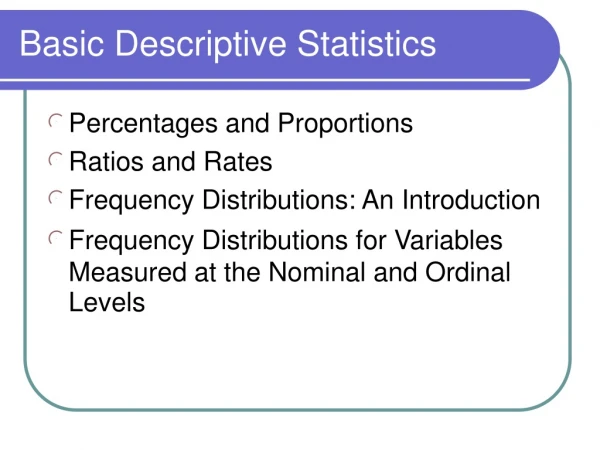
Statistics (cont.). Psych 231: Research Methods in Psychology. Quiz 9 is due on Friday at midnight. Announcements. Inferential statistics used to generalize back. Population. Sample. 2 General kinds of Statistics Descriptive statistics Used to describe, simplify, & organize data sets

E N D
Statistics (cont.) Psych 231: Research Methods in Psychology
Quiz 9 is due on Friday at midnight Announcements
Inferential statistics used to generalize back Population Sample • 2 General kinds of Statistics • Descriptive statistics • Used to describe, simplify, & organize data sets • Describing distributions of scores • Inferential statistics • Used to test claims about the population, based on data gathered from samples • Takes sampling error into account. Are the results above and beyond what you’d expect by random chance? Statistics
Population Sample A Treatment X = 80% Sample B No Treatment X = 76% • Purpose: To make claims about populations based on data collected from samples • What’s the big deal? • Example Experiment: • Group A - gets treatment to improve memory • Group B - gets no treatment (control) • After treatment period test both groups for memory • Results: • Group A’s average memory score is 80% • Group B’s is 76% • Is the 4% difference a “real” difference (statistically significant) or is it just sampling error? Inferential Statistics
Population Sample A Treatment X = 80% Sample B No Treatment X = 76% • Purpose: To make claims about populations based on data collected from samples • Two approaches based on quantifying sampling error • Hypothesis Testing • “There is a statistically significant difference between the two groups” • Confidence Intervals • “The mean difference between the two groups is between 4% ± 2%” Inferential Statistics
Population Sample A Treatment X = 80% Sample B No Treatment X = 76% • Purpose: To make claims about populations based on data collected from samples • Sampling error is how much a difference you might get between your sample and your population resulting from “chance” (random sampling) • Factors affecting “chance” • Sample size • Population variability Inferential Statistics
Population mean Population Distribution Sampling error (Pop mean - sample mean) x n = 1 Sampling error
Population mean Population Distribution Sample mean Sampling error (Pop mean - sample mean) x x n = 2 Sampling error
Population mean Population Distribution Sample mean x x x x x x x x x x Sampling error (Pop mean - sample mean) • Generally, as the sample size increases, the sampling error decreases n = 10 Sampling error
Small population variability Large population variability • Typically the narrower the population distribution, the narrower the range of possible samples, and the smaller the “chance” Sampling error
Population Distribution of sample means XB XC XD Avg. Sampling error “chance” XA • These two factors combine to impact the distribution of sample means. • The distribution of sample means is a distribution of all possible sample means of a particular sample size that can be drawn from the population Samples of size = n “Standard error” (SE) Sampling error
X Population Distribution of sample means Sample σ s μ “chance” • These two factors combine to impact the distribution of sample means. Avg. Sampling error Difference from chance More info
Population Sample A Treatment X = 80% Sample B No Treatment X = 76% • Two approaches • Hypothesis Testing • “There is a statistically significant difference between the two groups” • Confidence Intervals • “The mean difference between the two groups is between 4% ± 2%” Inferential Statistics
Step 2: Set your decision criteria • Step 3: Collect your data from your sample(s) • Step 4: Compute your test statistics • Step 5: Make a decision about your null hypothesis • “Reject H0” • “Fail to reject H0” • Step 1: State your hypotheses Testing Hypotheses
This is the hypothesis that you are testing • Step 1: State your hypotheses • Null hypothesis (H0) • Alternative hypothesis(ses) • “There are no differences (effects)” • Generally, “not all groups are equal” • You aren’t out to prove the alternative hypothesis(although it feels like this is what you want to do) • If you reject the null hypothesis, then you’re left with support for the alternative(s) (NOT proof!) Testing Hypotheses
Step 1: State your hypotheses • In our memory example experiment • Null H0: mean of Group A = mean of Group B • Alternative HA: mean of Group A ≠ mean of Group B • (Or more precisely: Group A > Group B) • It seems like our theory is that the treatment should improve memory. • That’s the alternative hypothesis. That’s NOT the one the we’ll test with inferential statistics. • Instead, we test the H0 Testing Hypotheses
Step 2: Set your decision criteria • Your alpha level will be your guide for when to: • “reject the null hypothesis” • “fail to reject the null hypothesis” • Step 1: State your hypotheses • This could be correct conclusion or the incorrect conclusion • Two different ways to go wrong • Type I error: saying that there is a difference when there really isn’t one (probability of making this error is “alpha level”) • Type II error: saying that there is not a difference when there really is one (probability of making this error is “beta”) Testing Hypotheses
Real world (‘truth’) H0 is correct H0 is wrong Type I error Reject H0 Experimenter’s conclusions Fail to Reject H0 Type II error Error types
Real world (‘truth’) Defendant is innocent Defendant is guilty Type I error Find guilty Jury’s decision Type II error Find not guilty Error types: Courtroom analogy
Type I error: concluding that there is an effect (a difference between groups) when there really isn’t. • Sometimes called “significance level” • We try to minimize this (keep it low) • Pick a low level of alpha • Psychology: 0.05 and 0.01 most common • For Step 5, we compare a “p-value” of our test to the alpha level to decide whether to “reject” or “fail to reject” to H0 • Type II error: concluding that there isn’t an effect, when there really is. • Related to the Statistical Power of a test • How likely are you able to detect a difference if it is there Error types
Step 3: Collect your data from your sample(s) • Step 4: Compute your test statistics • Descriptive statistics (means, standard deviations, etc.) • Inferential statistics (t-tests, ANOVAs, etc.) • Step 5: Make a decision about your null hypothesis • Reject H0“statistically significant differences” • Fail to reject H0“not statistically significant differences” • Make this decision by comparing your test’s “p-value” against the alpha level that you picked in Step 2. • Step 1: State your hypotheses • Step 2: Set your decision criteria “Statistically significant differences” • Essentially this means that the observed difference is above what you’d expect by chance (standard error) Testing Hypotheses
Real world (‘truth’) H0 is correct H0 is wrong Type I error Reject H0 Experimenter’s conclusions Fail to Reject H0 Type II error H0 is true (no treatment effect) 76% 80% XB XA • Tests the question: • Are there differences between groups due to a treatment? Two possibilities in the “real world” One population Two sample distributions Step 4: “Generic” statistical test
Real world (‘truth’) H0 is correct H0 is wrong Type I error Reject H0 Experimenter’s conclusions Fail to Reject H0 Type II error XB XA XA • Tests the question: • Are there differences between groups due to a treatment? Two possibilities in the “real world” H0 is false (is a treatment effect) H0 is true (no treatment effect) Two populations XB 76% 80% 76% 80% People who get the treatment change, they form a new population (the “treatment population) Step 4: “Generic” statistical test
XA XB • ER: Random sampling error • ID: Individual differences (if between subjects factor) • TR: The effect of a treatment • Why might the samples be different? (What is the source of the variability between groups)? Step 4: “Generic” statistical test
TR + ID + ER ID + ER XA XB • The generic test statistic - is a ratio of sources of variability • ER: Random sampling error • ID: Individual differences (if between subjects factor) • TR: The effect of a treatment Observed difference Computed test statistic = = Difference from chance Step 4: “Generic” statistical test
Population Distribution of sample means XB XC XD Avg. Sampling error XA • The distribution of sample means is a distribution of all possible sample means of a particular sample size that can be drawn from the population Samples of size = n Difference from chance Recall: Sampling error
Test statistic TR + ID + ER ID + ER • The generic test statistic distribution • To reject the H0, you want a computed test statistics that is large • reflecting a large Treatment Effect (TR) • What’s large enough? The alpha level gives us the decision criterion Distribution of the test statistic Distribution of sample means α-level determines where these boundaries go Step 4: “Generic” statistical test
The generic test statistic distribution • To reject the H0, you want a computed test statistics that is large • reflecting a large Treatment Effect (TR) • What’s large enough? The alpha level gives us the decision criterion Distribution of the test statistic Reject H0 2.5% 2.5% “two-tailed” with α = 0.05 Fail to reject H0 Step 4: “Generic” statistical test
The generic test statistic distribution • To reject the H0, you want a computed test statistics that is large • reflecting a large Treatment Effect (TR) • What’s large enough? The alpha level gives us the decision criterion Distribution of the test statistic Reject H0 “One tailed test”: sometimes you know to expect a particular difference (e.g., “improve memory performance”) 5.0% “one-tailed” with α = 0.05 Fail to reject H0 Step 4: “Generic” statistical test
TR+ ID + ER TR+ ID + ER TR + ID + ER ID + ER ID + ER ID + ER XA XA XB XB • Things that affect the computed test statistic • Size of the treatment effect (effect size) • The bigger the effect, the bigger the computed test statistic • Difference expected by chance (standard error) • Variability in the population • Sample size Step 4: “Generic” statistical test
Two types typically • Standard Error (SE) • diff by chance • Confidence Intervals (CI) • A range of plausible estimates of the population mean CI: μ = (X) ± (tcrit) (diff by chance) Error bars
1 factor with two groups • T-tests • Between groups: 2-independent samples • Within groups: Repeated measures samples (matched, related) • 1 factor with more than two groups • Analysis of Variance (ANOVA) (either between groups or repeated measures) • Multi-factorial • Factorial ANOVA Some inferential statistical tests
Observed difference X1 - X2 T = Diff by chance Based on sampling error • Design • 2 separate experimental conditions • Degrees of freedom • Based on the size of the sample and the kind of t-test • Formulae: Computation differs for between and within t-tests CI: μ=(X1-X2)±(tcrit)(Diff by chance) T-test
Reporting your results • The observed difference between conditions • Kind of t-test • Computed T-statistic • Degrees of freedom for the test • The “p-value” of the test • “The mean of the treatment group was 12 points higher than the control group. An independent samples t-test yielded a significant difference, t(24) = 5.67, p < 0.05, 95% CI [7.62, 16.38]” • “The mean score of the post-test was 12 points higher than the pre-test. A repeated measures t-test demonstrated that this difference was significant significant, t(12) = 7.50, p < 0.05, 95% CI [8.51, 15.49].” T-test
XA XC XB • Designs • More than two groups • 1 Factor ANOVA, Factorial ANOVA • Both Within and Between Groups Factors • Test statistic is an F-ratio • Degrees of freedom • Several to keep track of • The number of them depends on the design Analysis of Variance (ANOVA)
Observed variance F-ratio = XA XC XB Variance from chance • More than two groups • Now we can’t just compute a simple difference score since there are more than one difference • So we use variance instead of simply the difference • Variance is essentially an average difference Analysis of Variance (ANOVA)
XA XC XB • 1 Factor, with more than two levels • Now we can’t just compute a simple difference score since there are more than one difference • A - B, B - C, & A - C 1 factor ANOVA
The ANOVA tests this one!! Do further tests to pick between these XA = XB = XC XA ≠ XB ≠ XC XA ≠ XB = XC XA = XB ≠ XC XA = XC ≠ XB XA XC XB Null hypothesis: H0: all the groups are equal Alternative hypotheses • HA: not all the groups are equal 1 factor ANOVA
XA ≠ XB ≠ XC XA ≠ XB = XC XA = XB ≠ XC XA = XC ≠ XB • Planned contrasts and post-hoc tests: • - Further tests used to rule out the different Alternative hypotheses Test 1: A ≠ B Test 2: A ≠ C Test 3: B = C 1 factor ANOVA
Reporting your results • The observed differences • Kind of test • Computed F-ratio • Degrees of freedom for the test • The “p-value” of the test • Any post-hoc or planned comparison results • “The mean score of Group A was 12, Group B was 25, and Group C was 27. A 1-way ANOVA was conducted and the results yielded a significant difference, F(2,25) = 5.67, p < 0.05. Post hoc tests revealed that the differences between groups A and B and A and C were statistically reliable (respectively t(1) = 5.67, p < 0.05 & t(1) = 6.02, p < 0.05). Groups B and C did not differ significantly from one another” 1 factor ANOVA
We covered much of this in our experimental design lecture • More than one factor • Factors may be within or between • Overall design may be entirely within, entirely between, or mixed • Many F-ratios may be computed • An F-ratio is computed to test the main effect of each factor • An F-ratio is computed to test each of the potential interactions between the factors Factorial ANOVAs
Consider the results of our class experiment ✓ • Main effect of cell phone ✓ • Main effect of site type ✓ • An Interaction between cell phone and site type 0.04 -0.78 Factorial design example Resource: Dr. Kahn's reporting stats page
Reporting your results • The observed differences • Because there may be a lot of these, may present them in a table instead of directly in the text • Kind of design • e.g. “2 x 2 completely between factorial design” • Computed F-ratios • May see separate paragraphs for each factor, and for interactions • Degrees of freedom for the test • Each F-ratio will have its own set of df’s • The “p-value” of the test • May want to just say “all tests were tested with an alpha level of 0.05” • Any post-hoc or planned comparison results • Typically only the theoretically interesting comparisons are presented Factorial ANOVAs
The following slides are available for a little more concrete review of distribution of sample means discussion. Distribution of sample means
Population Sample • Distribution of sample means is a “theoretical” distribution between the sample and population • Mean of a group of scores • Comparison distribution is distribution of means Distribution of sample means Distribution of sample means
2 4 6 8 • A simple case • Population: • All possible samples of size n = 2 Assumption: sampling with replacement Distribution of sample means
2 4 6 8 mean mean mean 4 6 5 8 2 5 4 8 6 8 4 6 2 6 6 2 4 8 6 7 2 8 6 4 5 8 8 8 4 2 6 6 6 4 4 6 8 7 • A simple case • Population: • All possible samples of size n = 2 There are 16 of them 2 2 2 2 4 3 4 5 3 4 Distribution of sample means
5 4 3 2 1 2 3 4 5 6 7 8 means In long run, the random selection of tiles leads to a predictable pattern mean mean mean 2 2 2 4 6 5 8 2 5 2 4 3 4 8 6 8 4 6 2 6 4 6 2 4 8 6 7 2 8 5 6 4 5 8 8 8 4 2 3 6 6 6 4 4 4 6 8 7 Distribution of sample means
N > 30 • Shape • If population is Normal, then the dist of sample means will be Normal • If the sample size is large (n > 30), regardless of shape of the population Distribution of sample means Population Properties of the distribution of sample means
Distribution of sample means same numeric value different conceptual values • Center • The mean of the dist of sample means is equal to the mean of the population Population Properties of the distribution of sample means