Download

1 / 15
150 likes | 267 Views
High Summer Air Temperatures and Public Health : Tver Case Study. Boris Revich 1 , Dmitry Shaposhnikov* 2 1 Center for Demography and Human Ecology RAS, 2 High School of Economy, Moscow Project was supported by Russian Foundation for Fundamental Research and Environmental Defense (USA). 2003.

E N D
High Summer Air Temperatures and Public Health :Tver Case Study Boris Revich1,Dmitry Shaposhnikov*2 1Center for Demography and Human Ecology RAS, 2High School of Economy, Moscow Project was supported by Russian Foundation for Fundamental Research and Environmental Defense (USA). 2003
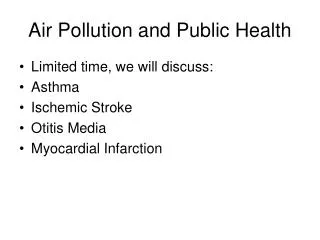
Introduction Extreme summer heat episodes in big cities lead to increased mortality risks. Famous “Chicago Heat” study demonstrated 85% increase of mortality during 5-day episode of extreme temperatures over 40ºC, relative to the same period in the previous years [McGeehin, Mirabelli, 2001]. Several episodes of extreme summer heat have been registered recently in Russian cities, which probably were caused by global warming. The purpose of this study was to prove relationship between high summer temperatures, air pollution, and morbidity and mortality among population in Russian Federation. The pilot project has been conducted in the city of Tver /450 thousand peoples/, situated 149 km. from Moscow. Used multiple regression techniques to prove this relationship and estimate power of association between environmental factors and public health.
Temperature and Meteorology Data Analysed temperature curves of four warmest months – June, July, August and September for three years – 1999, 2001, and 2002. During this period, maximal day temperature of 30ºC was exceeded: in 1999 - 14 times, in 2001 - 2 times, in 2002 - 3 times
Morbidity and mortality data We obtained statistics of daily morbidity from the city emergency medical service. The table below presents the diagnoses and number of cases for the study period (June–Sept., 1999) that used as dependent variables in analysis. Сauses of Morbidity[Emergency Medical Service]
Causes of mortality Mortality data were taken from bureau of civil census. Total mortality during the study period was 1 476 cases. All cases were specified for age, sex, and address of residence, for purposes of further stratification analysis. All cases were grouped into the following causes :
Air pollution data Daily air pollution data were taken from local station of weather monitoring of State Hydrometeorological service, which takes measurements three times a day. There are also several stationary and mobile air quality monitoring stations of State Sanitary and Epidemiological Surveillance Service. Concentrations of the such air pollutants as SO2, NO2, NO, TSP, CO, CS2 were obtained.
Study design and method Epidemiological hypothesis to be tested may be formulated as follows: “there are certain types of weather-related morbidity and mortality, that are positively associated with high summer temperatures”. In other words, on hot summer days one should observe increased incidence of certain types of morbidity and mortality among population. Standard regression techniques of daily morbidity and mortality on daily maximum temperatures were used to prove this hypothesis. Another topic which still has to be considered in the framework of this study is the relationship between air pollution, temperature and public health.
So far used linear and exponential regression techniques with time lags of 0, 1 and 2 days. The regression equations for linear model may be written as: Mn=a+bTn, if no time lag is expected, Mn=a+bTn-1, if time lag is expected to be one day, and Mn=a+bTn-2, if time lag is expected to be two days. Where: Mn and Tn stand for daily morbidity/mortality and daily maximum temperatures for the day n - where n varies from 1 to 122 (number of days ), b - slope factor, and a is intersection with Y-axis.
Preliminary Results Morbidity. To test the abovementioned epidemiological hypothesis, we formulated statistical “null hypothesis”: the coefficient b in the above regression equations is not significantly different from zero. If this hypothesis may be rejected at 95% level of statistical significance, then there is positive correlation between dependent variable (mortality or morbidity) and independent variable (temperature). Time-series linear and exponential regression analysis for 9 types of morbidity and for 13 types of mortality were used.
Of all types of morbidity, only “Ischemic heart disease, acute myocardial infarction” with two-day time lag was shown to be positively correlated with temperature. That is, the slope factor b in the regression equation was significantly different from zero. The regression equation was Mn=0.48+bTn-2, Where 0.48 is the intercept (background morbidity), and b=0.040+-0.019 is the slope factor, 0.019 is standard error of slope factor, p-value for b was 0.043, that is, null hypothesis may be rejected at more than (100%-4.3%) = 95.7% level of confidence. Temperature is measured in degrees Centigrade.
Mortality Daily mortality was shown to be positively correlated with temperatures with zero- and one-day time lags. Correlation was stronger with zero time lag. The regression equation for total mortality (mortality from all causes) on same-day temperature was Mn=14.5+bTn, where 14.5 is background mortality, b = 0.12+-0.06, is slope factor, 0.06 is standard error of b , p-value for b was 0.033, that is, null hypothesis might be rejected at more than (100%-3.3%) = 96.7% level of confidence. Roughly speaking, this regression equation means that increase of maximum daily temperature by each 10ºC will bring approximately one additional mortality on the same day in the city of Tver. This holds true for temperature range between approximately 15ºC and 35ºC.
Multiple time-series regression analysis of daily mortality did not give any statistically significant results. The following multiple regression equations were tested: Mn = a+b0Tn + b1Tn-1 + b2Tn-2, and Mn = a+b0Tn + b1Tn-1. We showed that all betas in these equations were statistically insignificant. The probable reason for it was autocorrelation between present-day and next-day temperatures. Exponential regression analysis did not show any statistically significant results.
Mortality by cause The following causes of death were chosen for statistical analysis of their association with daily temperatures: Of all types of mortality, only two diagnoses, “Cerebrovascular diseases” and “Poisoning and suicide” were shown to be positively correlated with temperature.
Cerebrovascular diseases increased with temperature for all time lags (zero, one and two day lags). The strongest correlation was observed with two-day time lag. The regression equation was Mn=0.41+bTn-2, Where b=0.045+-0.016 is the slope factor, p-value for b was 0.005. For “Poisoning and suicide” positive correlation with temperatures was observed with one-day time lag, the regression equation was Mn=.29+bTn-1; b = .033+-.015, p-value for b was 0.035.
Air pollution and air temperatures The analys of average daily concentrations of six air pollutants: SO2, NO2, NO, TSP, CO, CS2 found, that four of them have been positively correlated with maximum daily temperatures: TSP, SO2, NO2 and NO. Linear regression equations are shown below, with corresponding standard errors of slope factors: TSP = 1.38 + (.06+-.02)T SO2 = -.9 + (.49+-.24)T NO2 = -1.61 + (.19+-.04)T NO = -.54 + (.13+-.03)T. Elevated concentrations of pollutants may be explained by ground-level temperature inversions during hot summer days.