Download
1 / 18
190 likes | 363 Views
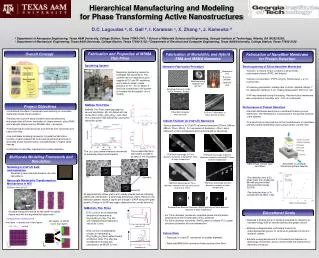
Ion Beam Analysis of the Composition and Structure of Thin Films. Torgny Gustafsson, Physics and Eric Garfunkel, Chemistry and Chemical Biology. Experimental Details.

E N D
Ion Beam Analysis of the Composition and Structure of Thin Films Torgny Gustafsson, Physics and Eric Garfunkel, Chemistry and Chemical Biology
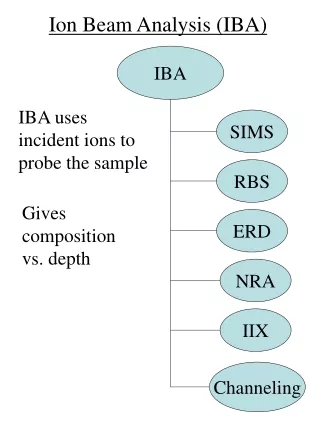
Experimental Details • Medium Energy Ion Scattering: A refinement of Rutherford Backscattering Spectroscopy with enhanced depth and angle resolution (~3Å vs. ~100Å) • A quantitative technique, with well known cross sections and an unusually short distance between data and interpretation • MEIS counts the number of atoms in the sample • By analyzing peak shapes (energy distributions), depth profiles can be obtained
MEIS facility at Rutgers* NRP chamber beam line ion implanter XPS system preparation chamber scattering chamber *Picture taken in 2004
Resonant nuclear reactions a 18O 15N p
H+ Energy [keV] Angle 2D MEIS Data SiO2/poly-Si/ZrO2/Ge(100) Energy distribution for one angle Angular distribution for one element Energy distributions: • mass (isotope) specific • quantitative (2% accuracy) • depth sensitive (at the sub-nm scale)
Energy spectrum and depth profiles Simulation of the peaks in the energy spectrum: scattering cross section stopping power (19 eV/Å in ZrO2) energy straggling detector resolution "Near surface" depth resolution 3 Å
Surface exchange Transition zone, SiOx SiO2 900 C Growth 800 C Si (crystalline) SiO2/Si(001) oxidation (isotope marking) • Faster interfacial SiO2 growth in case of high-k oxides in comparison to the SiO2 thickness growth for bare Si *Gusev, Lu, Gustafsson, Garfunkel, PRB52 (1995) 1759.
Atomic oxygen (O) transport in high-k films Oxygen (O2) transport in SiO2 SiO2 growth, O-exchange at interface O-exchange in surface layer O-diffusion and exchange in bulk of oxide SiO2 growth at interface O2 decomp. at surface Si-substrate Si-substrate O2 O O2 High-k Diffusion in gate dielectrics • SiO2 films: • amorphous after annealing • molecular O2 transport in SiO2 • decomposition by SiO desorption • (Many) high-k films: • tend to crystallize at low T • atomic O transport in high-k film • high oxygen mobility
30Å Al2O3 annealed in 3 Torr 18O2 ZrO2 film re-oxidized in 18O2 No change in Zr profile Surface flat by AFM Deeper O and Si Isotopic profiling of Zr and Al oxides • Significant interfacial SiO2 growth for ZrO2, less for Al2O3 • Dramatic oxygen exchange: 18O replaces 16O • SiO2 growth rate faster than DG-like growth
Presence of nitrogen in high-k film: effects on oxygen exchange • (HfO2)2(SiO2)/SiN/Si(001) films have been submitted to various post growth anneals (NH3, N2, O2, Tanneal =500-700oC) • only annealing in NH3/700oC/60s results in nitrogen incorporation in HfSiO6 with oxygen removal (final composition of HfSiO5N (O : N = 5:1))
HfO2.07 Ti 27Å TiOx SiO2 6Å HfO2 HfOx Si (100) SiO2 300oC UHV Ti RT HfSiOx Si (100) Si (100) Gettering of O in the dielectric by Ti overlayer As-deposited amorphous HfO2 film has small amount of interfacial SiO2 (~6-7Å) and excess of oxygen (~HfO2.07) Deposited Ti forms uniform layer, no strong intermixing with HfO2; Oxygen concentration in Ti layer is small (TiOx, x<0.10)
Ti HfO2 SiO2 Si (100) TiOx TiOd Composition of Ti/HfO2/SiO2/Si(001) gate stack(as-deposited) • Ti layer oxidizes on the surface and at the Ti/HfO2 interface (TiOx, x<1) • partial depletion of oxygen from HfO2 layer • HfO2 + Ti HfO2-x + VO (HfO2)+ TiOx • SiO2 remains at the HfO2/Si(001) interface
TiOx HfO1.9 HfSiOx Si (100) Compositional profile after anneal to 300oC • Ti + xO TiOx • Decrease of the Si surface peak and decrease of the width of the O peak indicate partial removal of SiO2 layer • Incorporation of some of the Si initially present in the interfacial SiO2 layer in the high-k layer • After air exposure Ti oxidation in the surface layer x/2 SiO2 + Ti x/2 Si + TiOx TiOx is Ti alloy overlayer DGo573K(x=0.49) = -54kJ/mol
HfO2 5Å InGaOx InGaAs(001) HfO2 deposition on S-passivated InGaAs(001) • Sulfur (1.3×10¹⁵atms/cm2) is distributed at the HfO2/InGaAs interface • HfO2 layer has small oxygen excess; • Thin Ga-rich interfacial In0.13Ga0.87Ox:S layer is present, • Elemental As can still present at the interface at small concentration S
XPS results: AlOx S ? HfO2 HfO2 a-InGaAsx a-InGaAsx InGaAs(001) InGaAs(001) s AlOx HfO2 S expected a-InGaAsx InGaAs(001) Depth profiling for Al/HfO2/S-pass. InGaAs(001)
SrTiO3 78Å SrO 2Å TiSixOy 6Å or SrTiO3 78Å Ti1-xSrxSiyOz 8Å Si(001) Si(001) Interface composition Normal incidence, 98keV H+, scattering angle 125o (substrate Si blocking) SrTiO3/SrTiSixOy/Si(001) Sr, Ti and O are observed in the interface region - they are visible to the ion beam (not blocked) in this scattering geometry