Download
1 / 1
10 likes | 115 Views
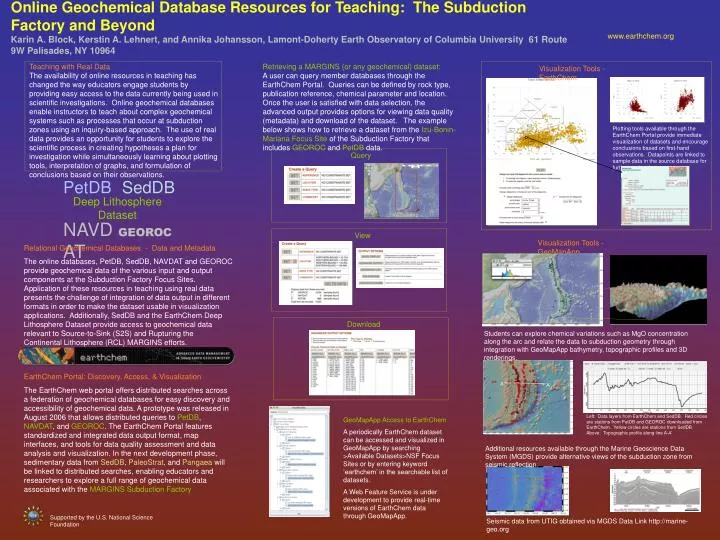
Visualization Tools - EarthChem. Plotting tools available through the EarthChem Portal provide immediate visualization of datasets and encourage conclusions based on first-hand observations. Datapoints are linked to sample data in the source database for further exploration. Query. PetDB.

E N D
Visualization Tools - EarthChem Plotting tools available through the EarthChem Portal provide immediate visualization of datasets and encourage conclusions based on first-hand observations. Datapoints are linked to sample data in the source database for further exploration. Query PetDB SedDB Deep Lithosphere Dataset NAVDAT GEOROC Students can explore chemical variations such as MgO concentration along the arc and relate the data to subduction geometry through integration with GeoMapApp bathymetry, topographic profiles and 3D renderings. A A’ Left: Data layers from EarthChem and SedDB. Red circles are stations from PetDB and GEOROC downloaded from EarthChem. Yellow circles are stations from SedDB. Above: Topographic profile along line A-A’ GeoMapApp Access to EarthChem A periodically EarthChem dataset can be accessed and visualized in GeoMapApp by searching >Available Datasets>NSF Focus Sites or by entering keyword ‘earthchem’ in the searchable list of datasets. A Web Feature Service is under development to provide real-time versions of EarthChem data through GeoMapApp. Additional resources available through the Marine Geoscience Data System (MGDS) provide alternative views of the subduction zone from seismic reflection. Seismic data from UTIG obtained via MGDS Data Link http://marine-geo.org www.earthchem.org Online Geochemical Database Resources for Teaching: The Subduction Factory and BeyondKarin A. Block, Kerstin A. Lehnert, and Annika Johansson, Lamont-Doherty Earth Observatory of Columbia University 61 Route 9W Palisades, NY 10964 Teaching with Real Data The availability of online resources in teaching has changed the way educators engage students by providing easy access to the data currently being used in scientific investigations. Online geochemical databases enable instructors to teach about complex geochemical systems such as processes that occur at subduction zones using an inquiry-based approach. The use of real data provides an opportunity for students to explore the scientific process in creating hypotheses a plan for investigation while simultaneously learning about plotting tools, interpretation of graphs, and formulation of conclusions based on their observations. Retrieving a MARGINS (or any geochemical) dataset: A user can query member databases through the EarthChem Portal. Queries can be defined by rock type, publication reference, chemical parameter and location. Once the user is satisfied with data selection, the advanced output provides options for viewing data quality (metadata) and download of the dataset. The example below shows how to retrieve a dataset from theIzu-Bonin-Mariana Focus Siteof the Subduction Factory that includesGEOROC and PetDBdata. View Visualization Tools - GeoMapApp Relational Geochemical Databases - Data and Metadata The online databases, PetDB, SedDB, NAVDAT and GEOROC provide geochemical data of the various input and output components at the Subduction Factory Focus Sites. Application of these resources in teaching using real data presents the challenge of integration of data output in different formats in order to make the dataset usable in visualization applications. Additionally, SedDB and the EarthChem Deep Lithosphere Dataset provide access to geochemical data relevant to Source-to-Sink (S2S) and Rupturing the Continental Lithosphere (RCL) MARGINS efforts. Download EarthChem Portal: Discovery, Access, & Visualization The EarthChem web portal offers distributed searches across a federation of geochemical databases for easy discovery and accessibility of geochemical data. A prototype was released in August 2006 that allows distributed queries to PetDB, NAVDAT, and GEOROC. The EarthChem Portal features standardized and integrated data output format, map interfaces, and tools for data quality assessment and data analysis and visualization. In the next development phase, sedimentary data from SedDB, PaleoStrat, and Pangaea will be linked to distributed searches, enabling educators and researchers to explore a full range of geochemical data associated with theMARGINS Subduction Factory Supported by the U.S. National Science Foundation