Download
1 / 31
310 likes | 503 Views
CMAS Meeting – Oct 7, 2008. Measurements of ozone in the troposphere from the Tropospheric Emission Spectrometer (TES) and applications to understanding air quality. Greg Osterman TES Science Team Jet Propulsion Laboratory/California Institute of Technology Collaborators:

E N D
CMAS Meeting – Oct 7, 2008 Measurements of ozone in the troposphere from the Tropospheric Emission Spectrometer (TES) and applications to understanding air quality Greg Osterman TES Science Team Jet Propulsion Laboratory/California Institute of Technology Collaborators: Mark Estes, Clint Harper, Weining Zhao, Doug Boyer, Jim Smith (TCEQ) Jay Al-Saadi (NASA Langley Research Center) Brad Pierce (NOAA/NESDIS) Kevin Bowman, Brian Kahn, Bill Irion, Ming Luo (JPL) Wallace McMillan (UMBC) Mark Shephard (AER) Debbie Lowe, Jan Baxter (EPA – Region 9) Robert Chatfield (NASA – Ames Research Center) Edmund Seto (University of California at Berkeley) Rick Van Schoik, Joe Fernando, Stacey Shi (Arizona St. University) Copyright 2008 California Institute of Technology. Government sponsorship acknowledged.
TES on EOS-Aura Launched 2004.07.15
TES Level 2 Data Version 3 • The Version 3 TES data includes: • Limb profiles valid into the upper troposphere • Improvements to the temperature retrievals (updated CO2 spectroscopy) • Improvements to the methane retrievals • Species dependent quality control information • Use of GMAO GEOS-5 products in L2 retrievals • O3, CO, H2O, HDO, TATM , SST validated with known biases • CH4, Limb Products provisionally validated • F04_04 in filename • TES Version 3 data products began processing January 2007 • Complete reprocessing completed (Sep 2004 – Sep 2008) • TES data and documentation can be found: • Langley Atmospheric Science Data Center (http://eosweb.larc.nasa.gov/) • Aura Validation Data Center (http://avdc.gsfc.nasa.gov/) • TES L2 Data User’s Guide available at both sites • TES L2 Validation Report available at both sites
TES Level 2 Data Version 4 • The Version 4 TES data will include: • Limb profiles valid into the upper troposphere • Improvements to the temperature retrievals (updated CO2 spectroscopy) • Improvements to the methane retrievals • Species dependent quality control information • Use of GMAO GEOS-5 products in L2 retrievals • F04_04 in filename • Data production began September 2008 (forward processing) • Full reprocessing expected by mid-2009 • Preliminary validation analyses are underway
Pressure (hPa) Clear (DOFS = 4.1) Cloud at 483 hPa (DOFS = 3.0) Averaging Kernels for Ozone 10-100 hPa 100-500 hPa 500-1000 hPa
TES Nadir Coverage TES Footprint 5 x 8 km Global Survey footprints 180 km apart Every 2 days… 612 and counting Step & Stare footprints 45 km apart Special observation Transect footprints 12 km apart Special observation
TES Nadir Ozone Validation Overview • Seasonal/Latitudinal statistics with ozonesonde comparisons • High bias of 3-10 ppbv (sondes) • High bias of ~7 ppbv (DIAL Lidar) • Stratospheric column ~3 DU high compared with MLS • Total column ~10 DU high compared with OMI • Atmospheric variability affects the observed differences • Analyses primarily using V002 data • Relative variations in ozone measured by TES meaningful R Nassar et al., 2008 N Richards et al., 2008 G Osterman et al., 2008
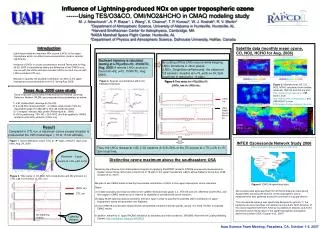
Elevated CO and O3 over SE Texas observed from TES on Aug 23, 2006 • Lower tropospheric ozone traces back to boundary layer production in the SE/ Atlantic Coast region (RAQMS – Lagrangian Back Trajectories) • Middle tropospheric ozone circulated over Texas/Louisiana • Air quality at the surface in SE Texas was good/moderate (below EPA O3 standard)
Elevated CO and O3 over SE Texas observed from TES on Aug 23, 2006 • Lower tropospheric ozone traces back to boundary layer production in the SE/ Atlantic Coast region (RAQMS – Lagrangian Back Trajectories) • Middle tropospheric ozone circulated over Texas/Louisiana • Air quality at the surface in SE Texas was good/moderate (below EPA O3 standard)
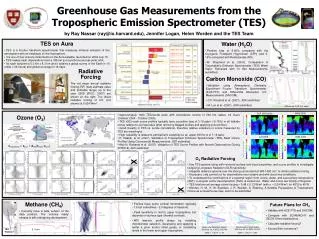
Vertically resolved record of CO M Luo, JPL
Vertically resolved record of O3 M Luo, JPL
Examination of the effect of the Esperanza Fire on tropospheric ozone using TES and other satellite instruments • TES measures the vertical profiles of ozone and carbon monoxide down wind of the plume (Very large plume of CO) • Also use OMI, MLS, AIRS and surface monitor data to understand the evolution of ozone in the plume and possible air quality implications G Osterman et al., 2008 (in prep) October 26, 2006 – California Wildfire
Featured on NASA Fire & Smoke page: http://www.nasa.gov/mission_pages/fires/main/index.html Northern California FiresJune 23, 2008
CHINA Methanol Ammonia First Satellite Observations of Lower Tropospheric Ammonia (NH3) and Methanol (CH3OH) Southern CA Beer et al., 2008
CHINA Methanol Ammonia First Satellite Observations of Lower Tropospheric Ammonia (NH3) and Methanol (CH3OH) Southern CA Enhanced values near Beijing Beer et al., 2008
CHINA Methanol Ammonia First Satellite Observations of Lower Tropospheric Ammonia (NH3) and Methanol (CH3OH) Southern CA Enhanced values near Beijing Beer et al., 2008 • Work underway to develop NH3 and other species as standard product • Preliminary data ready ~2009 • M Shephard (AER), M Luo (JPL) – TES Lead • Working with EPA (R Pinder) to analyze preliminary NH3 retrievals
Overview of Collaboration with TCEQ • Collaborate with the Texas Commission on Environmental Quality (TCEQ) to improve the modeling of ozone episodes in Texas • Meteorological and air quality models are the primary tools for developing emission strategies to bring TX into attainment with EPA Standards • What we are doing: • Applications: • Using chemical transport model results as lateral and vertical boundary conditions for the TCEQ air quality model (CAMx) • Using TES (O3, CO, Sea Surface Temperature), AIRS (Temperature, H2O, CO), AMSR-E (Sea Surface Temperature) for benchmarking MM5 and CAMx model results • Research Studies: • Evaluating the effects of transport of pollutants originating outside the state boundaries • Nighttime ozone over Texas
TCEQ uses nested CAMx model runs 36 ´ 36 km 12 ´ 12 km 4 ´ 4 km Currently modeling 5 time periods during 2005 & 2006 Current boundary conditions are based on ground monitor data from EPA ~ 200 ground monitors in Texas (25 in Houston Area) Primary model evaluation data Mostly located in urban areas No data over the Gulf of Mexico TCEQ Modeling Grid Air Quality Model Evaluation
TES can provide vertically resolved information on ozone and carbon monoxide in the troposphere Information in rural areas away from surface monitors Information over the Gulf AIRS CO provides better spatial coverage with vertical information TCEQ Modeling Grid Air Quality Model Evaluation
TES can provide vertically resolved information on ozone and carbon monoxide in the troposphere Information in rural areas away from surface monitors Information over the Gulf AIRS CO provides better spatial coverage with vertical information TCEQ Modeling Grid Air Quality Model Evaluation
Used GEOS-Chem Near Real Time results for time period July 24 – August 8, 2005 to provide boundary conditions in the troposphere for CAMx model Small improvement for July 29-30 and August 3-4 in Galveston for comparisons with surface monitors Learning the best way to implement the use of CTM’s RAQMS Work (Song et al., Collaboration with Environ Expect improvement in model values of ozone above the boundary layer (not validated yet) Preliminary Results - Galveston Cyan: CAMx Surface Ozone w/ original BC Red: O3 from Surface Monitor (ppbv) Preliminary Model Results Blue: CAMx Surface Ozone w/ GEOS-Chem BC
Model Ozone in Free Troposphere • Beginning evaluation of initial CAMx model results with TES data • Preliminary Result – CAMx model higher than TES in lower troposphere • Future Work: Statistics of model/TES comparisons of O3 and CO • Future Work: • Comparison of MM5 temperature, humidity fields to AIRS and TES • Comparison of improved TCEQ treatment of sea surface temperature in MM5 with TES and AMSR-E
Status of Work with TCEQ • Identified the types of measurements that will be useful to TCEQ • Provided initial boundary conditions for July-August 2005 time period (GEOS-Chem) • New boundary conditions did lead to improvement in CAMx surface ozone as compared to ground stations along the Texas coast • Need to improve the downscaling procedure for creating boundary/initial conditions • Provided help with Quikscat data for use in TCEQ modeling • Direct use of data from A-Train instruments to benchmark model results used in making air quality policy decisions • CAMx is used by many state/local air quality boards • Work done with TCEQ can be modified to work with other air quality models (CMAQ)
CMAQ Prior to use of TES CMAQ Using TES Boundary Conditions Collaboration with EPA Region 9 Goal 1: Use of satellite data (TES and OMI, and ozone sondes) to augment EPA activities (surface monitors, health data and models) in trying to mitigate the health effects of ozone episodes along the US-Mexico Border Goal 2: Work with EPA to understand the strengths of Aura satellite data for understanding air pollution events EPA Region 9 Advanced Monitoring Initiative: US – Mexico Border Pollution Preliminary Result: Improvements in modeling of free troposphere over SW United States by air quality models (CMAQ) using TES data as model boundary conditions Result: A project report is being finalized, work has been distributed widely within EPA CMAQ=Community Multi-scale Air Quality Modeling System Collaboration with EPA Region 9, JPL, UC-Berkeley, NASA Ames RC, Arizona State University Note change in scale
Collaboration with EPA Region 9 Aura Contribution: Using OMI/MLS products to map tropospheric ozone along with the ability of TES to provide vertical information on ozone and carbon monoxide in the troposphere to help the EPA to understand air pollution events TES Contribution: TES provided special observations across the US/Mexico border near San Diego and El Paso Future Work: The work in this project is an example of how NASA satellite data might be used with EPA tools and health data for studying air pollution events and their health impacts CA/Mexico Border TES special observation near San Diego on June 7, 2007 showing enhanced levels of ozone in the lower troposphere on the US side of the border (San Diego) EPA surface monitors measured low surface ozone in areas near TES measurements
June 7, 2007 – TES Transect over US/Mexico Border A Google Earth image of a TES “curtain” of ozone from June 9, 2007. In this case the greenish colors are high tropospheric ozone on both sides of the border.
Conclusions • TES is providing unprecedented vertically resolved chemical observations of the Earth’s lower atmosphere. • 4 years of measurements, processed consistently, with validated products are available. • For details and links to data go to: http://tes.jpl.nasa.gov Copyright 2008 California Institute of Technology. Government sponsorship acknowledged.
Conclusions • TES is providing unprecedented vertically resolved chemical observations of the Earth’s lower atmosphere. • 4 years of measurements, processed consistently, with validated products are available. • For details and links to data go to: http://tes.jpl.nasa.gov Email: Gregory.Osterman@jpl.nasa.gov Thank You! Copyright 2008 California Institute of Technology. Government sponsorship acknowledged.