Download
1 / 1
10 likes | 144 Views
SWE, 1981. Forcing Data (NetCDF, ALMA). Translate (VIC format). Translate (CLM format). Translate (ECMWF format). Translate (NOAH format). Translate (CHASM format). VIC. CLM. ECMWF. NOAH. CHASM. Translate. Translate. Translate. Translate. Translate. Results (NetCDF, ALMA).

E N D
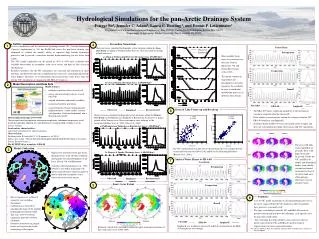
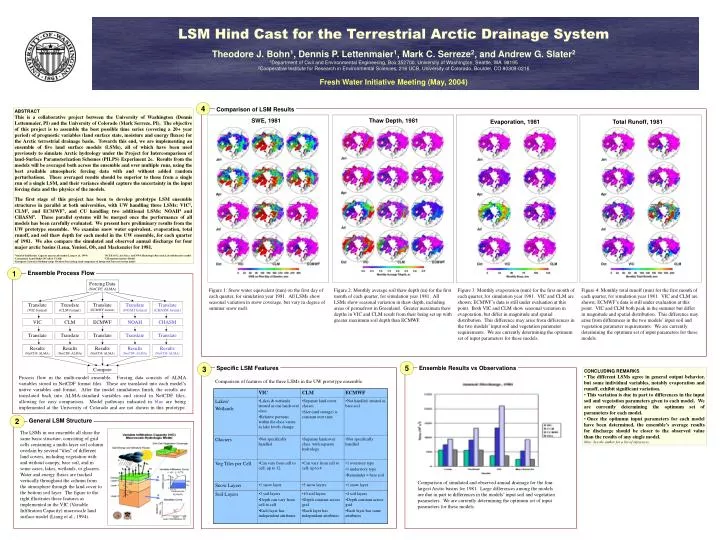
SWE, 1981 Forcing Data (NetCDF, ALMA) Translate (VIC format) Translate (CLM format) Translate (ECMWF format) Translate (NOAH format) Translate (CHASM format) VIC CLM ECMWF NOAH CHASM Translate Translate Translate Translate Translate Results (NetCDF, ALMA) Results (NetCDF, ALMA) Results (NetCDF, ALMA) Results (NetCDF, ALMA) Results (NetCDF, ALMA) Compare LSM Hind Cast for the Terrestrial Arctic Drainage System Theodore J. Bohn1, Dennis P. Lettenmaier1, Mark C. Serreze2, and Andrew G. Slater2 1Department of Civil and Environmental Engineering, Box 352700, University of Washington, Seattle, WA 98195 2Cooperative Institute for Research in Environmental Sciences, 216 UCB, University of Colorado, Boulder, CO 80309-0216 Fresh Water Initiative Meeting (May, 2004) 4 Comparison of LSM Results ABSTRACT This is a collaborative project between the University of Washington (Dennis Lettenmaier, PI) and the University of Colorado (Mark Serreze, PI).The objective of this project is to assemble the best possible time series (covering a 20+ year period) of prognostic variables (land surface state, moisture and energy fluxes) for the Arctic terrestrial drainage basin. Towards this end, we are implementing an ensemble of five land surface models (LSMs), all of which have been used previously to simulate Arctic hydrology under the Project for Intercomparison of land-Surface Parameterization Schemes (PILPS) Experiment 2e. Results from the models will be averaged both across the ensemble and over multiple runs, using the best available atmospheric forcing data with and without added random perturbations. These averaged results should be superior to those from a single run of a single LSM, and their variance should capture the uncertainty in the input forcing data and the physics of the models. The first stage of this project has been to develop prototype LSM ensemble structures in parallel at both universities, with UW handling three LSMs: VIC1, CLM2, and ECMWF3, and CU handling two additional LSMs: NOAH4 and CHASM5. These parallel systems will be merged once the performance of all models has been carefully evaluated. We present here preliminary results from the UW prototype ensemble. We examine snow water equivalent, evaporation, total runoff, and soil thaw depth for each model in the UW ensemble, for each quarter of 1981. We also compare the simulated and observed annual discharge for four major arctic basins (Lena, Yenisei, Ob, and Mackenzie) for 1981. 1Variable Infiltration Capacity macroscale model (Liang et al., 1994) 4NCEP, OSU, Air Force, and NWS Hydrologic Research Lab collaborative model 2Community Land Model (NCAR & UCAR) 5CHAmeleon Surface Model 3European Center for Medium-range Weather Forecasting, land component of Integrated Forecast System model Thaw Depth, 1981 Evaporation, 1981 Total Runoff, 1981 1 Ensemble Process Flow Figure 1: Snow water equivalent (mm) on the first day of each quarter, for simulation year 1981. All LSMs show seasonal variation in snow coverage, but vary in degree of summer snow melt. Figure 2: Monthly average soil thaw depth (m) for the first month of each quarter, for simulation year 1981. All LSMs show seasonal variation in thaw depth, including areas of permafrost in Greenland. Greater maximum thaw depths in VIC and CLM result from their being set up with greater maximum soil depth than ECMWF. Figure 3: Monthly evaporation (mm) for the first month of each quarter, for simulation year 1981. VIC and CLM are shown; ECMWF’s data is still under evaluation at this point. Both VIC and CLM show seasonal variation in evaporation, but differ in magnitude and spatial distribution. This difference may arise from differences in the two models’ input soil and vegetation parameter requirements. We are currently determining the optimum set of input parameters for these models. Figure 4: Monthly total runoff (mm) for the first month of each quarter, for simulation year 1981. VIC and CLM are shown; ECMWF’s data is still under evaluation at this point. VIC and CLM both peak in the summer but differ in magnitude and spatial distribution. This difference may arise from differences in the two models’ input soil and vegetation parameter requirements. We are currently determining the optimum set of input parameters for these models. 5 3 Specific LSM Features Ensemble Results vs Observations • CONCLUDING REMARKS • The different LSMs agree in general output behavior, but some individual variables, notably evaporation and runoff, exhibit significant variation. • This variation is due in part to differences in the input soil and vegetation parameters given to each model. We are currently determining the optimum set of parameters for each model. • Once the optimum input parameters for each model have been determined, the ensemble’s average results for discharge should be closer to the observed value than the results of any single model. • Note: See the author for a list of references. Process flow in the multi-model ensemble. Forcing data consists of ALMA variables stored in NetCDF format files. These are translated into each model’s native variables and format. After the model simulations finish, the results are translated back into ALMA-standard variables and stored in NetCDF files, allowing for easy comparison. Model pathways indicated in blue are being implemented at the University of Colorado and are not shown in this prototype. Comparison of features of the three LSMs in the UW prototype ensemble. 2 General LSM Structure The LSMs in our ensemble all share the same basic structure, consisting of grid cells containing a multi-layer soil column overlain by several “tiles” of different land covers, including vegetation with and without canopy, bare soil, and in some cases, lakes, wetlands, or glaciers. Water and energy fluxes are tracked vertically throughout the column from the atmosphere through the land cover to the bottom soil layer. The figure to the right illustrates these features as implemented in the VIC (Variable Infiltration Capacity) macroscale land surface model (Liang et al., 1994). Comparison of simulated and observed annual drainage for the four largest Arctic basins for 1981. Large differences among the models are due in part to differences in the models’ input soil and vegetation parameters. We are currently determining the optimum set of input parameters for these models.