Download
1 / 18
200 likes | 446 Views
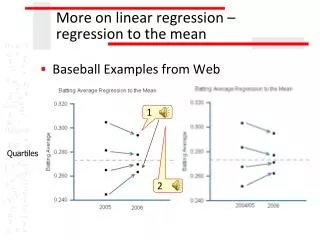
The general linear test approach to regression analysis. Three basic steps. Define a (larger) full model . Define a (smaller) reduced model . Use an F statistic to decide whether or not to reject the smaller reduced model in favor of the larger full model. The full model.

E N D
Three basic steps • Define a (larger) full model. • Define a (smaller) reduced model. • Use an F statistic to decide whether or not to reject the smaller reduced model in favor of the larger full model.
The full model The full model (or unrestricted model) is the model thought to be most appropriate for the data. For simple linear regression, the full model is:
The reduced model The reduced model (or restricted model) is the model described by the null hypothesis H0. For simple linear regression, the null hypothesis is H0: β1 = 0. Therefore, the reduced modelis:
The general linear test approach • “Fit the full model” to the data. • Obtain least squares estimates of β0 and β1. • Determine error sum of squares – “SSE(F).” • “Fit the reduced model” to the data. • Obtain least squares estimate of β0. • Determine error sum of squares – “SSE(R).”
The general linear test approach (cont’d) • Compare SSE(R) and SSE(F). • SSE(R) is always larger than (or same as) SSE(F). • If SSE(F) is close to SSE(R), then variation around fitted full model regression function is almost as large as variation around fitted reduced model regression function. • If SSE(F) and SSE(R) differ greatly, then the additional parameter(s) in the full model substantially reduce the variation around the fitted regression function.
How close is close? The test statistic is a function of SSE(R)-SSE(F): The degrees of freedom (dfR and dfF) are those associated with the reduced and full model error sum of squares, respectively. Reject H0 if F* is large (or if P-value is small).
But for simple linear regression, it’s just the same F test as before …
Null hypothesis H0: β1 = 0 Alternative hypothesis HA: β1 ≠ 0 Test statistic P-value = What is the probability that we’d get an F* statistic as large as we did, if the null hypothesis is true? (One-tailed test!) The P-value is determined by comparing F* to an F distribution with 1numerator degree of freedom and n-2denominator degrees of freedom. The formal F-test for slope parameter β1
Example: Alcoholism and Muscle strength? • Report on strength tests for a sample of 50 alcoholic men • X = total lifetime dose of alcohol (kg per kg of body weight) • Y = strength of deltoid muscle in man’s non-dominant arm
The ANOVA table Analysis of Variance Source DF SS MS F P Regression 1 504.04 504.040 33.5899 0.000 Error 48 720.27 15.006 Total 49 1224.32 SSE(R)=SSTO SSE(F)=SSE There is a statistically significant linear association between alcoholism and arm strength.